 BharatNotes
 Why this chapter matters for UPSC: Population composition is the "who" behind the population totals: how many women and men, how old, where they live, whether they can read, and what work they do. Each of these is a GS1 society topic in its own right: India's sex ratio and child sex ratio, the demographic dividend and population ageing, urbanisation, literacy and the shift of workers out of agriculture. This chapter was dropped from NCERT's rationalised edition: the 2026-27 reprint of the book has eight chapters, and none covers sex ratio, age structure or rural-urban composition. BharatNotes keeps it, because the exam has not dropped the topics.
Contemporary hook: The UN's World Population Prospects 2024 shows how unevenly the sexes are spread. Worldwide there are about 101 males for every 100 females (2025), close to NCERT's figure of 102. But in Qatar there are about 246 males per 100 females, and in the UAE 176, because of male migrant workers, while 160 of the 237 countries and areas in the data have more women than men. India's last census (2011) counted 943 females per 1,000 males and a child sex ratio of 919, down from 927 in 2001.
🧠 First Principles — Read This First
A population is not just a number; it has a structure. NCERT's opening point is that people can be told apart by "their age, sex and their place of residence", and by occupation, education and life expectancy. Composition is the share of each kind in the whole. Two countries of the same size can have very different futures: one with many children will need schools and jobs, one with many old people will need pensions and health care.
Each part of the structure is a clue to something else. The sex ratio reveals the status of women and the pattern of migration. The age structure reveals past birth and death rates and future needs, and the population pyramid draws it as a picture. Rural-urban composition reveals the level of urbanisation, literacy the level of socio-economic development, and occupational structure how far an economy has moved from primary to secondary, tertiary and quaternary work. Read each statistic as an answer to "what does this tell us about the society?"
PART 1 — Quick Reference
Measuring the Sex Ratio (NCERT)
| Formula | Who uses it | |
|---|---|---|
| Males per 1,000 (or 100) females | (Male population ÷ female population) × 1,000 | "Some countries"; the UN publishes males per 100 females |
| Females per 1,000 males | (Female population ÷ male population) × 1,000 | India (Census of India) |
A high figure means opposite things in the two formulas, so always state which one is used. Example: Latvia's NCERT figure of 85 males per 100 females is a female-majority population; India's 943 females per 1,000 males is a male-majority one.
The Sex Ratio Then and Now
| NCERT (from the UN Demographic Year Book) | UN WPP 2024, for 2025 | |
|---|---|---|
| World | 102 males per 100 females | 101.1 males per 100 females (989 females per 1,000 males) |
| Most female-majority | Latvia: 85 males per 100 females | Hong Kong (China, SAR): 81.8; Latvia now 86.6 |
| Most male-majority | Qatar: 311 males per 100 females | Qatar: 245.9; then UAE 176.0, Oman 166.0, Bahrain 163.4 |
| Countries favourable to women | 139 of 211 listed by the UN | 160 of 237 countries and areas |
| Asia | Low: China, India, Saudi Arabia, Pakistan, Afghanistan | China 103.7, India 106.4 males per 100 females |
| Europe | Males a minority, including Russia | Europe 93.4 males per 100 females |
India's Sex Ratio and Child Sex Ratio (Census)
| 2001 | 2011 total | 2011 rural | 2011 urban | |
|---|---|---|---|---|
| Sex ratio (females per 1,000 males) | 933 | 943 | 949 | 929 |
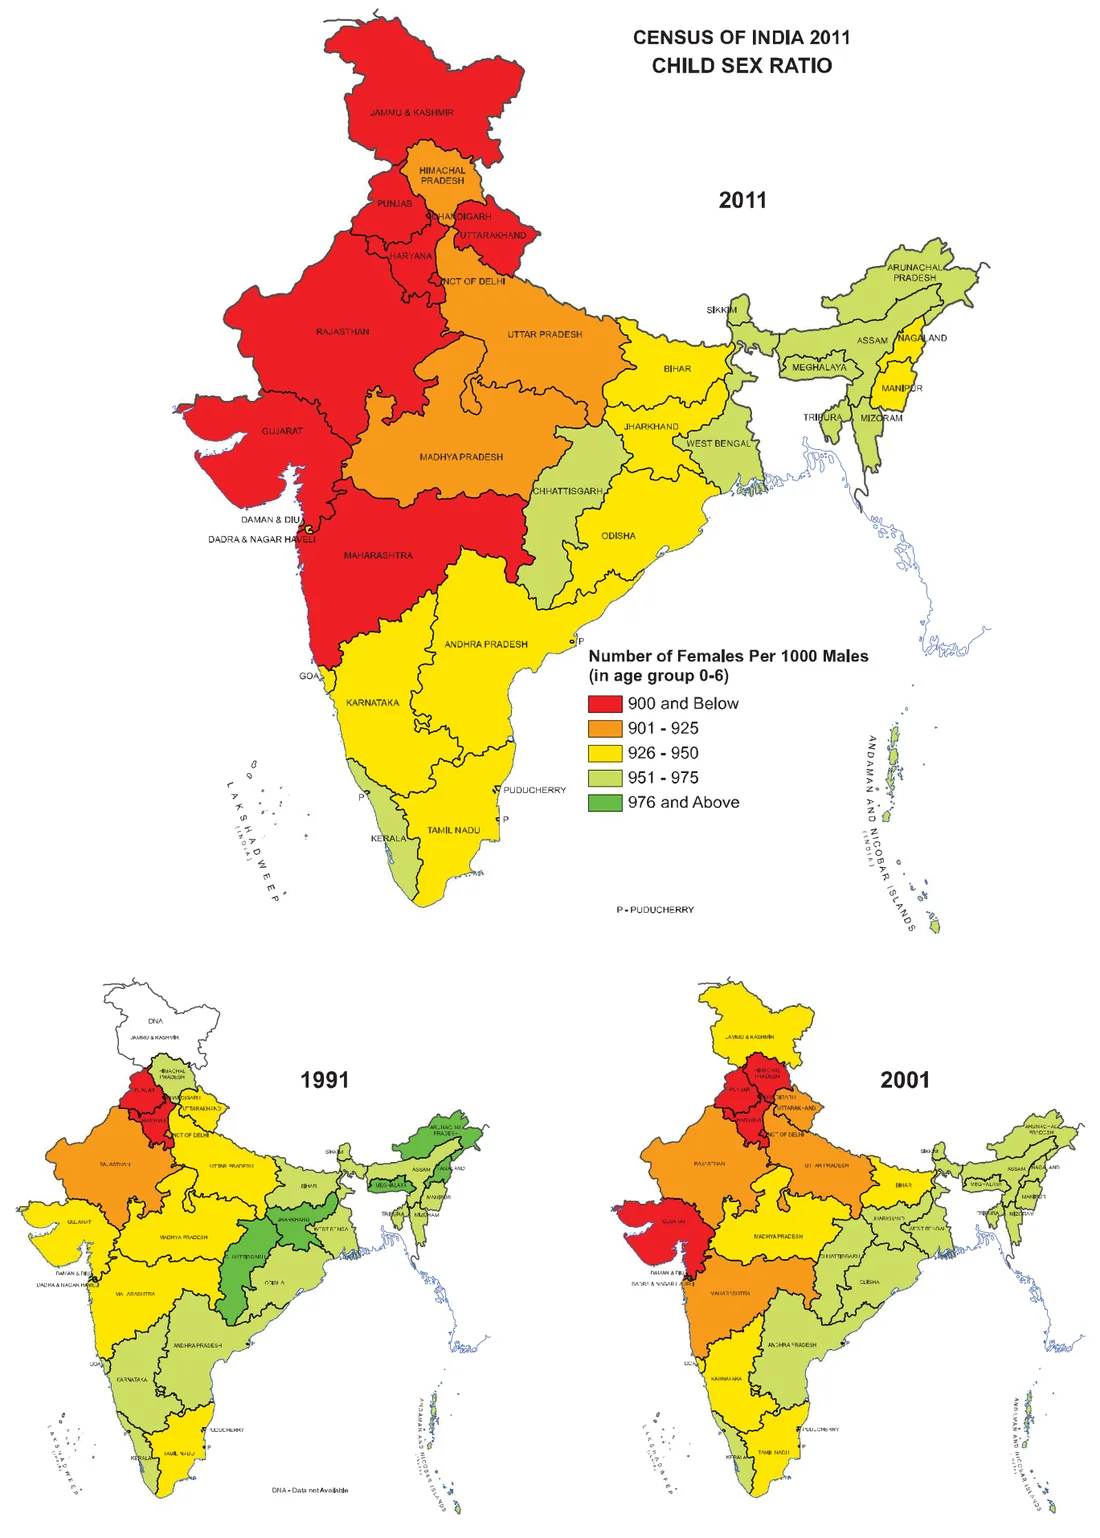
| Child sex ratio, ages 0-6 | 927 | 919 | 923 | 905 |
Lowest child sex ratios in 2011: Haryana 834 and Punjab 846. Source: Census of India 2011, Primary Census Abstract: Data Highlights, Statements 6 and 10.
Age Groups: NCERT's Bands and the UN's
| Group | NCERT | UN, World Bank and most international data |
|---|---|---|
| Working age | 15-59 years | 15-64 years |
| Old age (ageing) | Above 60 | 65 and over |
| Young | Below 15 | Below 15 |
NCERT's exercise asks which range is the working-age group; its answer is 15 to 59, even though 15 to 64 is also among the options. Use NCERT's band for NCERT questions and say "UN definition" when quoting 15-64 or 65+ data.
Where Countries Sit on the Sex-Ratio Scale
Four Age-Sex Pyramids
PART 2 — Concepts & Narrative
Sex Composition
The number of women and men is "an important demographic characteristic", and the sex ratio is "an important information about the status of women in a country". Where gender discrimination is rampant, the ratio is unfavourable to women: NCERT names female foeticide, female infanticide and domestic violence, and the lower socio-economic status of women. NCERT adds a warning: "more women in the population does not mean they have a better status", because men may have migrated elsewhere for work.
Natural advantage versus social disadvantage
NCERT states that "females have a biological advantage over males as they tend to be more resilient", but that this advantage "is cancelled out by the social disadvantages and discriminations that they face". This is why a sex ratio below parity, in a country without large male immigration, points to discrimination: with equal treatment, women's survival advantage would push the ratio towards more women at older ages. It is the logic behind India's attention to the child sex ratio (ages 0-6), which reflects discrimination at and soon after birth more directly than the overall ratio.
NCERT's world pattern: Asia generally has a low sex ratio (China, India, Saudi Arabia, Pakistan, Afghanistan), while in most of Europe, including Russia, males are in a minority. NCERT gives two reasons for Europe's male deficit: the better status of women, and "an excessively male-dominated out-migration to different parts of the world in the past". The current UN data in Part 1 keep the same broad pattern, and add the extreme case NCERT's exercise asks about: the low sex ratio of the UAE is caused by the "selective migration of male working population".
India's census record. India's sex ratio rose from 933 in 2001 to 943 in 2011, but the child sex ratio fell from 927 to 919. In 2011 the urban sex ratio (929) was lower than the rural (949), the Asian pattern NCERT describes below, and the child sex ratio was lowest in Haryana (834) and Punjab (846). NCERT's chapter on human development (ch. 4) notes the Government of India's Beti Bachao Beti Padhao programme as a response to the decline in the child sex ratio.
Age Structure and the Population Pyramid
Age structure is "the number of people of different age groups". NCERT reads it in three ways: a large population aged 15-59 means a large working population; a large share above 60 means an ageing population needing more spending on health care; and a large share of young people means a high birth rate and a youthful population. The age-sex pyramid shows the structure: males on the left and females on the right, as percentages in each age group. NCERT names three shapes:
| Type | NCERT's example | Shape and meaning | UN WPP 2024, 2025: under 15 / 65 and over |
|---|---|---|---|
| Expanding | Nigeria (Bangladesh and Mexico "would look the same") | Triangular, wide base; large young population from high birth rates; typical of less developed countries | Nigeria 40.5% / 3.1% |
| Constant | Australia | Bell-shaped, tapered towards the top; NCERT: birth and death rates "almost equal leading to a near constant population" | Australia 17.7% / 18.1% |
| Declining | Japan | Narrow base, tapered top; low birth and death rates; growth "usually zero or negative" in developed countries | Japan 11.2% / 30.0% |
The figure in Part 1 draws all three from current UN data, with India added, on one scale. Two of NCERT's descriptions need updating. Australia is not near-constant now: its population grew by about 1% in 2023, with a birth rate of 11.5 and a death rate of 7.0 per thousand (UN WPP 2024), so its bell shape comes with steady growth. Japan has gone beyond "low birth and death rates": since its death rate (12.3) now exceeds its birth rate (6.0), its population is falling. India (24.2% under 15, 7.4% aged 65 and over) has a base that has begun to narrow below a broad working-age bulge, which is the demographic dividend in picture form.
Ageing Population
Population ageing is "the process by which the share of the older population becomes proportionally larger", which NCERT calls "a new phenomenon of the twentieth century". In most developed countries the older age groups have grown because life expectancy has risen, and the share of children has fallen because birth rates have fallen. The UN figures make the range clear: people aged 65 and over are 30.0% of Japan's population, 18.1% of Australia's, 10.4% of the world's, 7.4% of India's and 3.1% of Nigeria's (WPP 2024, 2025).
Dependency, dividend and ageing in one frame
Children and old people depend on the working-age population. A falling birth rate first shrinks the young share while the old share is still small, so for a few decades the working-age share is unusually large: this is the demographic dividend, an opportunity that pays off only if those workers find productive jobs and have the health and skills to do them. As the large working-age groups grow old, the old share rises: this is ageing, which raises spending on pensions and health care, as NCERT says. India's pyramid in Part 1 shows the dividend phase; Japan's shows the ageing phase that follows it.
Rural-Urban Composition
People are divided into rural and urban by residence, because rural and urban life differ in livelihood and social conditions, and in age-sex-occupational structure, density and development. The criteria vary from country to country; in general terms, NCERT says, rural areas are those where people are engaged in primary activities, and urban areas those where most of the working population is in non-primary activities.
NCERT's key comparison (its Fig. 3.4): in Canada and western Europe (Finland), males outnumber females in rural areas and females outnumber males in urban areas; in Asian countries like Nepal, Pakistan and India, and in Zimbabwe, it is the reverse. NCERT's reasons: in the West, women migrate from rural areas to the many urban jobs, and highly mechanised farming remains largely a male occupation; in Asia, cities remain male-dominated because migration to them is mostly male, women's participation in farming is fairly high, and the shortage of housing, the high cost of living, the paucity of jobs and the lack of security in cities discourage women from moving. India's 2011 census shows the Asian pattern: 929 females per 1,000 males in towns against 949 in villages.
How urban is the world? UN DESA's World Urbanization Prospects 2025 gives two answers. By each country's own definition, 57.8% of the world's people lived in urban areas in 2025, rising to a projected 67.3% by 2050; India's figure is 35.7% in 2025 and 43.1% in 2050. By a common international method, the "Degree of Urbanisation", 44.9% live in cities and 35.6% in towns. The difference is itself NCERT's point that definitions vary. India's 2011 census counted 37.71 crore urban people out of 121.06 crore, about 31.2%.
Literacy
The proportion of literate people indicates a country's socio-economic development: it "reveals the standard of living, social status of females, availability of educational facilities and policies of government", and economic development is "both a cause and consequence of literacy". In India, the literacy rate is the percentage of the population aged 7 and above who can read, write and do arithmetic with understanding. The 2011 census put it at 73.0% (rural 67.8%, urban 84.1%), up from 64.8% in 2001 (Primary Census Abstract). A figure of 74.04% is also often quoted for 2011: that was the provisional count, released before the final abstract.
Occupational Structure
The working population (NCERT: ages 15 to 59) works in agriculture, forestry, fishing, manufacturing, construction, commerce, transport, services and communication. NCERT groups them into four sectors: primary (agriculture, forestry, fishing, mining), secondary (manufacturing), tertiary (trade, transport, communication and other services) and quaternary (research, information technology and developing ideas). The share of workers in each sector "is a good indicator of the levels of economic development of a nation", because only a developed economy with industries and infrastructure can employ more people outside primary activities.
India's latest figures show the shift under way: the Periodic Labour Force Survey Annual Report 2025 (January to December 2025) puts agriculture at 43.0% of workers, down from 44.8% in 2024, with manufacturing at 12.1%, construction at 12.0% and other services at 13.1%.
PART 3 — UPSC Integration
Cross-paper relevance
- GS1 (Society, Geography): sex ratio and child sex ratio, causes of regional variation, ageing, urbanisation, migration's effect on composition.
- GS2 (Social Justice): schemes for girls (Beti Bachao Beti Padhao), elderly care, education and literacy.
- GS3 (Economy): demographic dividend, employment structure and the shift out of agriculture (PLFS 2025).
- Essay: themes on women's status, the young and the old, and cities.
Frames that score. For a question on India's adverse sex ratio, use NCERT's two-sided frame (biological advantage cancelled by social disadvantage), then the census evidence (943 overall, 919 for children, Haryana 834 and Punjab 846) and NCERT's caution that migration can raise or lower a local ratio. For ageing or the dividend, draw or describe the pyramid: shape first, then what it implies for schools, jobs, pensions and health care. For urbanisation, state the definition used, because the national and international measures differ by more than ten percentage points.
Data discipline. Census figures (2011) are counts; NFHS and SRS figures are survey estimates; UN WPP figures are modelled estimates and projections. Do not mix them in one sentence, and give the year with each.
Exam Strategy
For Prelims: Learn the two sex-ratio formulas and which India uses, NCERT's world extremes (Latvia, Qatar) and the UAE explanation, the three pyramid types with NCERT's example countries, NCERT's 15-59 working-age band, the literacy definition (aged 7 and above) and the four sectors. Know Census 2011's 943 and 919 and the lowest states.
For Mains: Pair each concept with one dated figure: a pyramid with WPP 2024 shares, urbanisation with WUP 2025, occupation with PLFS 2025, literacy with the 2011 census.
Avoid: treating the overall sex ratio and the child sex ratio as the same; quoting 74.04% as the final 2011 literacy rate; and assuming more women means better status (NCERT's own warning).
Practice Questions
Practice (UPSC-pattern, not past papers). Questions 1 to 3 are NCERT's own exercise MCQs.
Prelims:
Which one of the following has caused the sex ratio of the United Arab Emirates to be low?
(a) Selective migration of male working population
(b) High birth rate of males
(c) Low birth rate of females
(d) High out-migration of femalesWhich one of the following figures represents the working age group of the population (NCERT)?
(a) 15 to 65 years
(b) 15 to 64 years
(c) 15 to 66 years
(d) 15 to 59 yearsWhich one of the following countries has the highest sex ratio in the world (NCERT)?
(a) Latvia
(b) United Arab Emirates
(c) Japan
(d) FranceConsider the following statements about India's Census of 2011:
- The sex ratio was 943 females per 1,000 males.
- The child sex ratio (0-6 years) was higher than in 2001.
- The urban sex ratio was lower than the rural sex ratio.
Which of the statements given above are correct?
(a) 1 and 2 only
(b) 1 and 3 only
(c) 2 and 3 only
(d) 1, 2 and 3
- The sex ratio was 943 females per 1,000 males.
A population pyramid with a narrow base and a wide top indicates:
(a) high birth rates and a youthful population
(b) birth and death rates that are almost equal
(c) low birth rates and an ageing population
(d) heavy male in-migrationIn NCERT's account, which of the following is the usual rural-urban sex pattern in Asian countries such as India and Nepal?
(a) More females in urban areas than in rural areas
(b) More males in urban areas, because migration to cities is mainly male
(c) Equal sex ratios in rural and urban areas
(d) More males in rural areas, because farming is mechanised
Mains:
- "More women in the population does not mean they have a better status." Explain with reference to the sex ratio and migration. (150 words)
- Discuss the factors responsible for imbalances in the sex and age structure in different parts of the world. (250 words)
- Describe the rural-urban composition of population, and explain why the sex ratio of cities differs between Western and Asian countries. (250 words)
📦 Revision Capsule
Hard Facts
- India measures the sex ratio as females per 1,000 males; the UN publishes males per 100 females
- NCERT: world 102 males per 100 females; Latvia 85 (most female); Qatar 311 (most male); favourable to women in 139 of 211 countries
- UN WPP 2024 (2025): world 101.1; Qatar 245.9, UAE 176.0; 160 of 237 countries and areas have more women
- Census 2011: sex ratio 943 (rural 949, urban 929); child sex ratio 919 (2001: 927); lowest Haryana 834, Punjab 846
- Pyramids (NCERT): expanding = Nigeria; constant = Australia; declining = Japan
- 65 and over (2025): Japan 30.0%, world 10.4%, India 7.4%, Nigeria 3.1%
- Urban (WUP 2025): world 57.8% (2025) → 67.3% (2050); India 35.7% (2025); Census 2011 India about 31.2%
- Literacy (Census 2011, final): 73.0%; aged 7 and above
- PLFS 2025: agriculture 43.0% of workers; manufacturing 12.1%; construction 12.0%
Core Concepts
- Composition = age, sex, residence, literacy, occupation
- Biological advantage of women vs social disadvantage
- Pyramid shape = past births and deaths, future needs
- Western cities more female, Asian cities more male (migration patterns)
- Sector shares of workers = level of development
Confused Pairs
- Sex ratio (all ages) vs child sex ratio (0-6)
- Females per 1,000 males (India) vs males per 100 females (UN)
- Working age 15-59 (NCERT, Census) vs 15-64 (UN)
- Provisional 2011 literacy 74.04% vs final 73.0%
- National-definition urban share vs Degree of Urbanisation (cities and towns)
PYQ Pattern
- Mains has asked why the tribal sex ratio is more favourable to women than the Scheduled Caste ratio, why prosperous regions have adverse sex ratios, how globalisation affects the aged, and what India must do to realise its demographic dividend.
Sources
- NCERT, Fundamentals of Human Geography (Class XII), ch. 3 "Population Composition", 2021-22 print: book archive, Wayback copy. Not in the Reprint 2026-27 edition: 2026 book archive.
- Office of the Registrar General and Census Commissioner, Census of India 2011, Primary Census Abstract: Data Highlights, India, chapter 1 (Statements 1, 6 and 10) and chapter 3 (Statement 19, literacy): chapter 1, Wayback copy, chapter 3, Wayback copy.
- UN DESA Population Division, World Population Prospects 2024, population by five-year age group and sex, and demographic indicators (medium variant): population.un.org/wpp.
- UN DESA Population Division, World Urbanization Prospects 2025: Summary of Results (2025): desapublications.un.org.
- Ministry of Statistics and Programme Implementation, Press Note on the PLFS Annual Report 2025 (January-December 2025), 27 March 2026: PIB release.