 BharatNotes
Part 5 of 9 of the Soils and Biogeography notes. The overview page has the quick revision and exam strategy for all nine parts.
Soil Degradation and Conservation
Soil forms at the pace of centuries and can be lost in a single monsoon. This part explains how land degrades (by water, wind, salt and misuse), how India and the world measure the damage, which conservation measures work and why, and what India has pledged and done.
Cross-paper relevance
- GS1 (Geography, primary): soil erosion by water and wind, ravines and badlands, drylands and the aridity index, soil conservation measures
- GS3 (Environment): land degradation and desertification, India's degraded area in the ISRO atlas, Land Degradation Neutrality, the 26 Mha restoration pledge and the Bonn Challenge, the Aravalli Green Wall Project, UNCCD COP16 and COP17
- GS3 (Agriculture): salinisation, waterlogging and chemical decline of farm soils, conservation on farmland, the Soil Health Card scheme
What land degradation is
NCERT gives the textbook definition: "In a broad sense, soil degradation can be defined as the decline in soil fertility, when the nutritional status declines and depth of the soil goes down due to erosion and misuse." Its degree "varies from place to place according to the topography, wind velocity and amount of the rainfall" (NCERT).
Policy documents use a wider term, land degradation, which takes in vegetation and water as well as soil. India's 2023 national action plan defines it as "the reduction or loss of the biological and economic productivity and complexity of irrigated and non-irrigated agricultural lands, pastures, rangelands, forests and forested lands" (MoEFCC NAP 2023). Desertification is land degradation in the drylands (explained under wind erosion, drylands and desertification below); the plan notes that the French forester Aubreville used the word "as early as 1949".
Why it matters: FAO puts it in three lines. "95% of our food comes from soils", and "It can take up to 1 000 years to produce just 2-3 cm of soil" (FAO, World Soil Day page, read 17 Nov 2026). On a human time scale, eroded topsoil does not come back.
Don't confuse
Soil degradation (NCERT) is loss of fertility and depth. Land degradation (UNCCD, NAP) is loss of productivity of the whole land system: soil, vegetation and water. Desertification is land degradation in arid, semi-arid and dry sub-humid areas, whatever the cause; it does not mean deserts spreading by themselves.
Water erosion: from raindrop to ravine
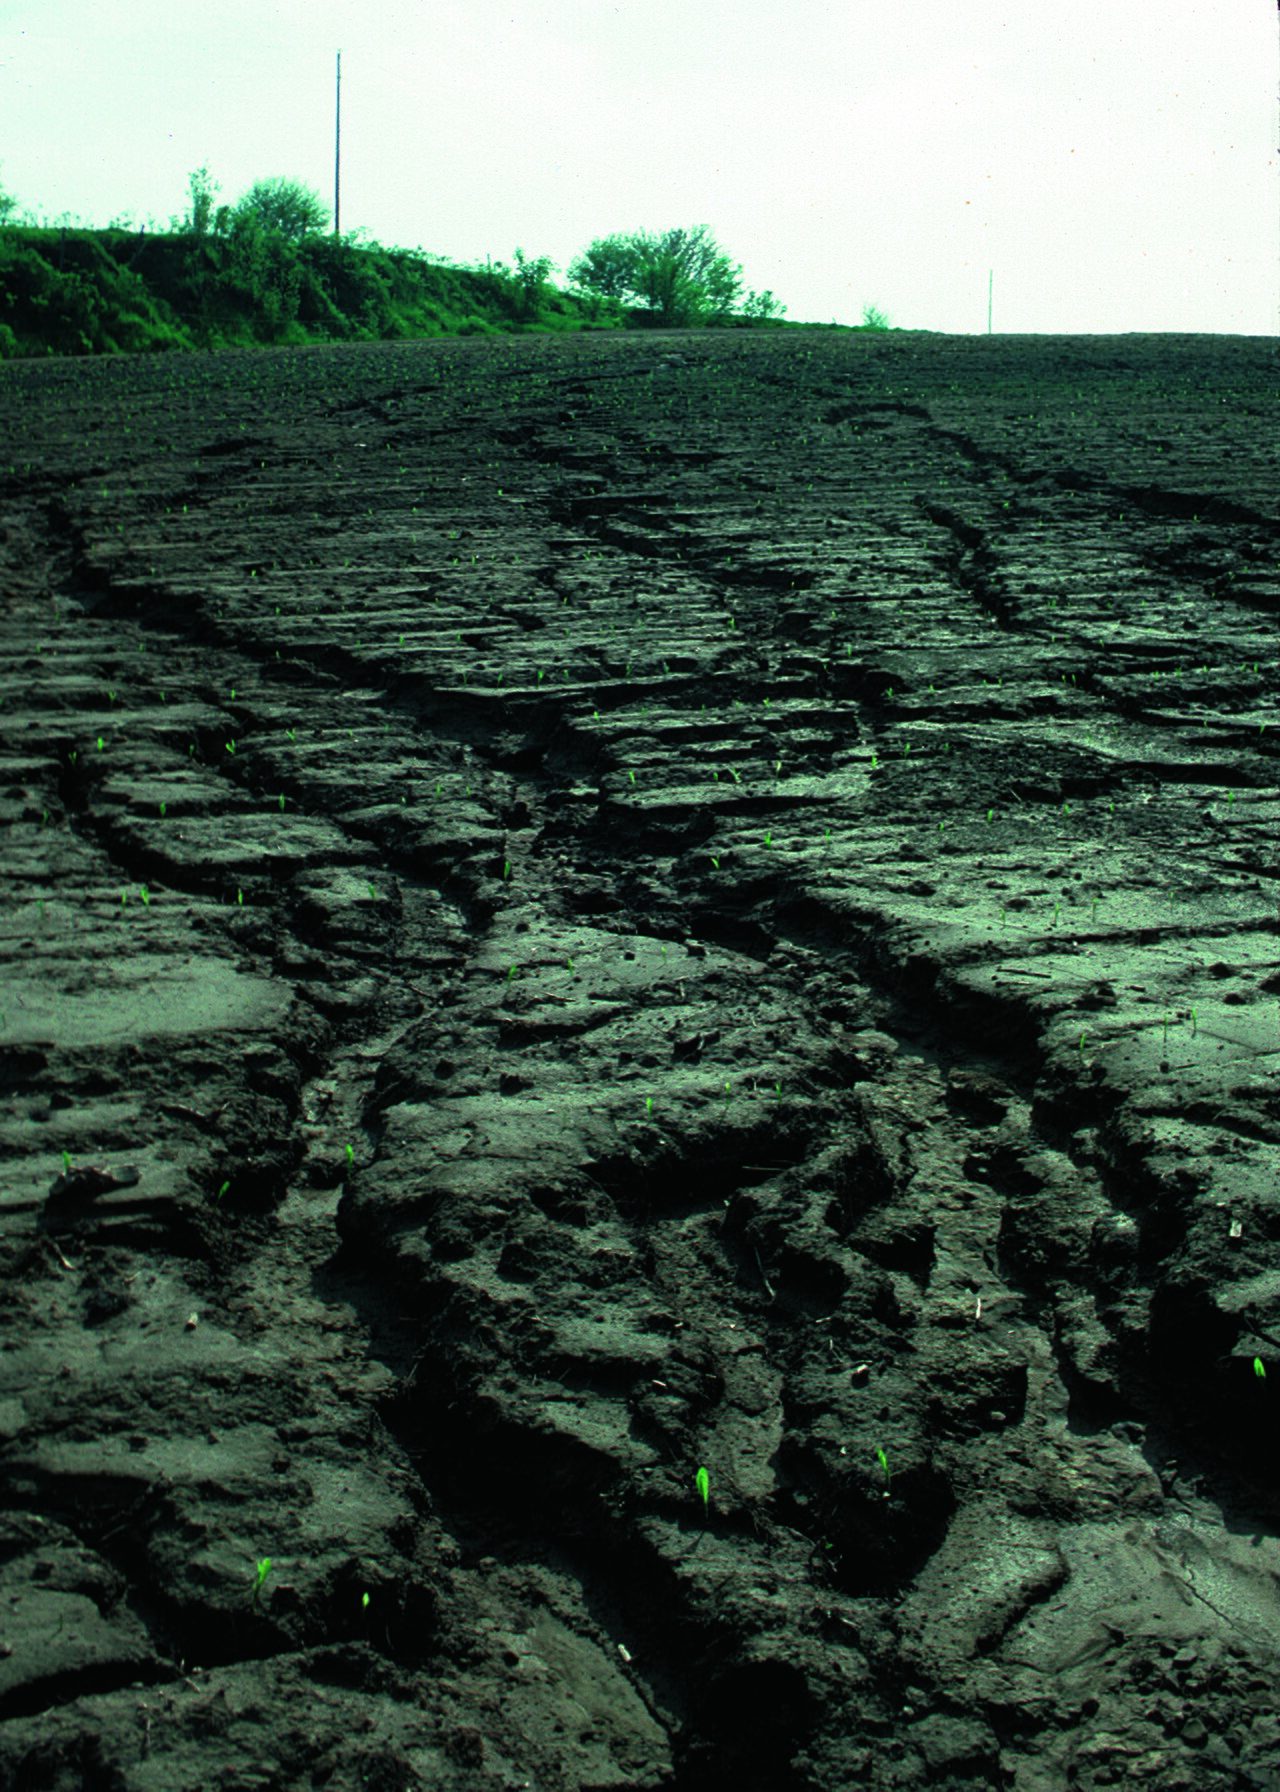
"The destruction of the soil cover is described as soil erosion" (NCERT). Soil formation and erosion go on simultaneously and are generally in balance, but natural or human factors can disturb that balance. Human activities are "responsible for soil erosion to a great extent": forest and other natural vegetation is removed for settlement, for cultivation and for grazing (NCERT). "Wind and water are powerful agents of soil erosion"; in regions with heavy rainfall and steep slopes, erosion by running water is the more significant, and in India it takes place "mainly in the form of sheet and gully erosion" (NCERT).
The sequence
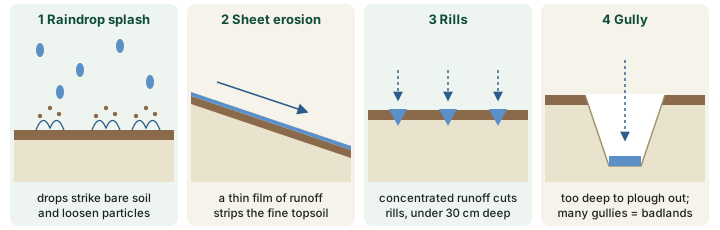
Water erosion begins before any stream forms. Splash erosion is the break-up of clods and the scattering of soil particles "by the kinetic energy of the raindrop impacting on the soil" (FAO LADA project, Manual for Local Level Assessment of Land Degradation, Sustainable Land Management and Livelihoods, Part 2, Annex 1), which is why mulch protects the soil "from the rain drop impact" (NAP 2023). Runoff then removes the loosened soil in three increasingly visible forms, which the action plan lists as "sheet, rill or gully erosion".
- Sheet erosion "takes place on level lands after a heavy shower and the soil removal is not easily noticeable. But it is harmful since it removes the finer and more fertile top soil" (NCERT).
- Rill erosion is "the grooving action by many small rivulets and water channels caused by concentrated surface runoff. Rills do not exceed 30cm in depth and they can be readily removed by cultivation" (FAO LADA manual). Even small gullies, under 1 m deep, "cannot be removed by ordinary cultivation" (FAO LADA manual).
- Gully erosion "is common on steep slopes. Gullies deepen with rainfall, cut the agricultural lands into small fragments and make them unfit for cultivation" (NCERT).
Ravines and badlands
"A region with a large number of deep gullies or ravines is called a badland topography. Ravines are widespread, in the Chambal basin. Besides this, they are also found in Tamil Nadu and West Bengal. The country is losing about 8,000 hectares of land to ravines every year" (NCERT). NCERT does not date the 8,000 ha estimate; quote it as NCERT's figure.
Erosion also harms land far from where it starts. The eroded material is carried into rivers, lowers their carrying capacity and causes floods (NCERT). And "Deforestation is one of the major causes of soil erosion". "Plants keep soils bound in locks of roots", and their shed leaves and twigs add humus. Forests have been cleared in most parts of India, but NCERT notes that the effect on erosion is greater in the hilly parts of the country.
Why it happens
Bare ground erodes far faster than covered ground. The action plan reports that "Studies have shown" that "bare ground allows four times more soil erosion compared to permanent plant covered ground" (NAP 2023). Every biological measure described under conserving soil below works by keeping the ground covered.
Wind erosion, drylands and desertification
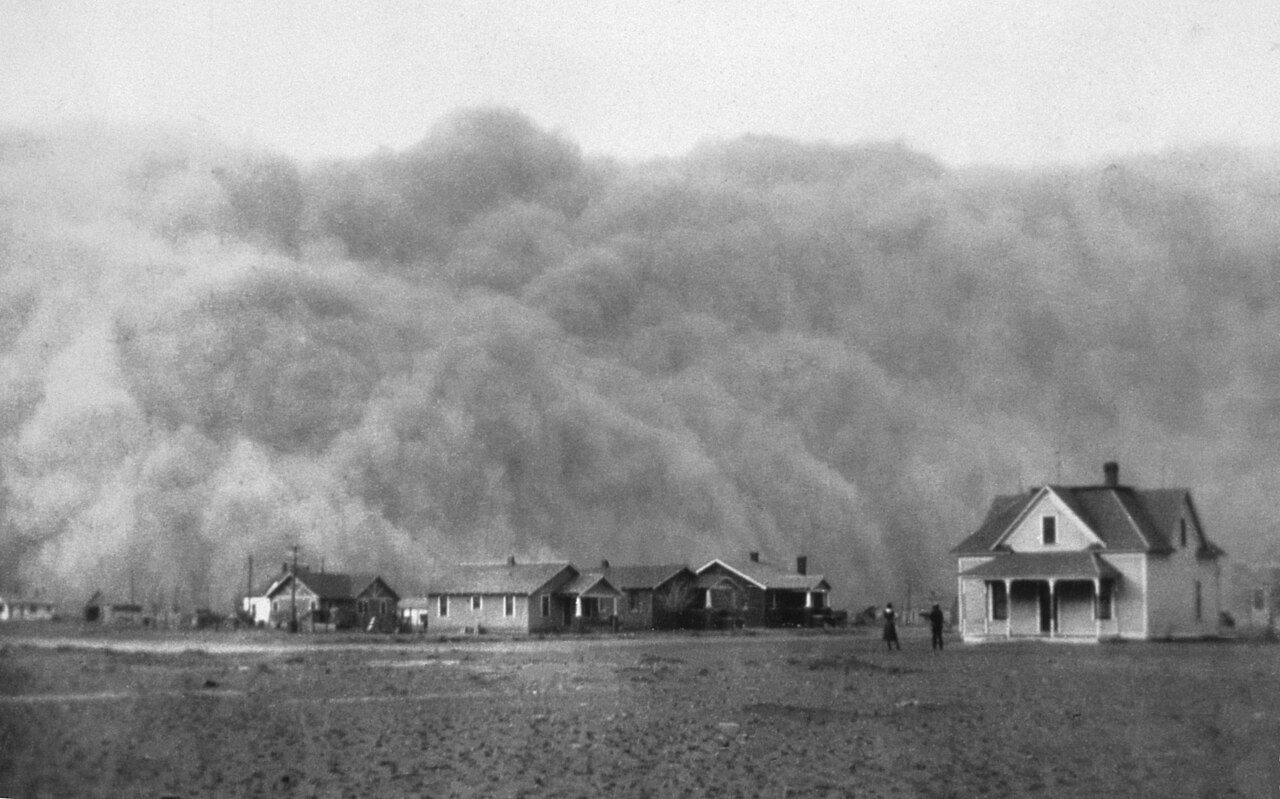
"Wind erosion is significant in arid and semi-arid regions" (NCERT). Wind lifts the loose, dry, fine particles and spreads sand over productive land; the atlas defines it as "the spread of sand which can erode soil" (NAP 2023). In India's arid region wind erosion is the leading process; in the semi-arid and dry sub-humid regions water erosion and vegetation degradation lead (NAP 2023, from the atlas).
Drylands and the aridity index
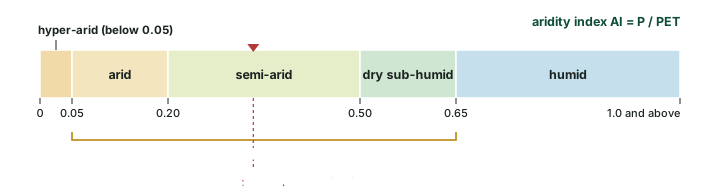
"The arid, semi-arid, and dry sub-humid areas, are collectively known as drylands" (NAP 2023). They are defined by the aridity index (AI), the ratio of mean annual precipitation (P) to potential evapotranspiration (PET), the water the air could draw from a wet surface. The lower the AI, the drier the land. "Desertification in drylands is due to climatic variations and/or human activities" (NAP 2023).
Worked example: Is a place a dryland?
A district receives 500 mm of rain a year; its potential evapotranspiration is 1,500 mm. Which aridity class is it in? (Illustrative numbers.)
- AI = P / PET = 500 / 1,500 = 0.33.
- Semi-arid land has 0.20 < AI ≤ 0.50, so 0.33 falls in that class.
- Semi-arid land is part of the drylands, so degradation there counts as desertification.
Answer: AI = 0.33: semi-arid, a dryland. Note that the same rainfall with a PET of only 700 mm would give AI = 0.71, which is humid.
Remember
Aridity-index classes (NAP 2023): humid above 0.65; dry sub-humid 0.50-0.65; semi-arid 0.20-0.50; arid 0.05-0.20; hyper-arid below 0.05. Drylands = arid + semi-arid + dry sub-humid.
In the news: UNCCD COP16 (December 2024)
UNCCD COP16, Riyadh, 2-13 December 2024 (UNCCD COP16 page). No global drought regime was agreed; parties laid the groundwork for one, "which they intend to complete at COP17 in Mongolia in 2026". UNCCD reported that "some 77.6% of Earth's land has experienced drier conditions since the 1990s compared to the previous 30-year period", that drylands now cover 40.6% of all land excluding Antarctica, and that droughts affect the livelihoods of 1.8 billion people and cost about USD 300 billion a year. At least USD 2.6 trillion is needed by 2030 to restore more than one billion ha; "more than USD 12 billion were pledged" (UNCCD COP16 closing release, 14 Dec 2024).
In the news: UNCCD COP17 (August 2026)
UNCCD COP17, Ulaanbaatar, 17-28 August 2026. Again no drought decision: parties "decided to continue discussions at COP18 ... with a view to adopting a decision on the proactive management of drought at all levels", and drought stays a stand-alone agenda item. "More than 70 countries now have national drought plans, compared with only three in 2013." "An estimated US$355 billion a year is needed through 2030" for land restoration, against around US$77 billion invested (a gap of about US$278 billion a year, computed). A new Drought Resilience Investment Facility "aims to mobilize up to US$400 million". COP18 is "expected to take place in Egypt, in 2028" (UNCCD COP17 closing release, 28 Aug 2026).
Salinisation, waterlogging and chemical decline
Not all degradation removes soil. Some spoils it where it lies.
- Salinisation. Soils in irrigated areas are "becoming saline because of over-irrigation. The salt lodged in the lower profiles of the soil comes up to the surface and destroys its fertility" (NCERT). The atlas lists the causes as "excess evapotranspiration, drought, excess irrigation, and overuse of fertilizers" (NAP 2023). Soils of India shows, under saline soils, how capillary action brings the salt up, and why gypsum is the advised remedy.
- Waterlogging is "the accumulation of standing water for long periods caused by floods, excess irrigation, and incorrect planning of drainage" (NAP 2023). Waterlogged roots lack air.
- Chemical decline. Fertilisers help in the short run, but "Unless the soil gets enough humus, chemicals harden it and reduce its fertility in the long run" (NCERT). NCERT notes this is common in the command areas of river valley projects, "the first beneficiaries of the Green Revolution".
- Acidification. The 2010-11 national breakdown (the second table below) counts acidic soils as the second largest category after erosion.
- Mining and waste. The atlas also maps "manmade" degradation from "mining, quarrying, brick kilns, industrial effluents, city waste, and urban agglomeration" (NAP 2023).
How the atlas maps degradation
India's main national series is the Desertification and Land Degradation Atlas of India of the Space Applications Centre (SAC), ISRO, released on 17 June 2021 at the Ministry's virtual event for Desertification and Drought Day (PIB 1727987, 17 Jun 2021). It maps degradation from Indian Remote Sensing Satellite (IRS) AWiFS data at a scale of 1:500,000 for 2011-13 and 2018-19, records the process and its severity (high or low), and checks the images against field observations (NAP 2023). The atlas also reports a 2003-05 figure, so the series has three dates.
Processes the atlas maps
| Process | What it is or what causes it (atlas wording) |
|---|---|
| Vegetation degradation | deforestation, forest blanks, shifting cultivation, grazing |
| Water erosion | loss of soil cover mainly due to rainfall and surface runoff water |
| Wind erosion | spread of sand which can erode soil |
| Salinity | excess evapotranspiration, drought, excess irrigation, overuse of fertilisers |
| Waterlogging | floods, excess irrigation, incorrect planning of drainage |
| Frost shattering | breakdown of rocks because of differences in temperature |
| Frost heaving | ice lenses form under the soil |
| Mass movement | movement of masses of soil and rock due to gravity |
| Man-made | mining, quarrying, brick kilns, industrial effluents, city waste, urban agglomeration |
Source: SAC (ISRO), Desertification and Land Degradation Atlas of India (2021), as reproduced in MoEFCC, National Action Plan to Combat Desertification and Land Degradation through Forestry Interventions (2023), PDF p. 38 of the plan.
An older breakdown by the Ministry of Agriculture, for 2010-11, sorted degraded land by type and included soil chemistry. It is on a different basis from the atlas and gives a larger total, so the two must never be mixed in one sum.
Land degradation in India by type, 2010-11 (Ministry of Agriculture)
| Type | Area (Mha) | Share as printed (%) | Share computed (%) |
|---|---|---|---|
| Water and wind erosion | 94.87 | 79 | 78.8 |
| Acidic soils | 17.93 | 15 | 14.9 |
| Alkaline soils | 3.70 | 3 | 3.1 |
| Saline soils | 2.73 | 1.8 | 2.3 |
| Waterlogged land | 0.91 | 1 | 0.8 |
| Mining and industrial waste | 0.26 | 0.2 | 0.2 |
| Total | 120.40 | 100.0 | 100.0 |
Source: Ministry of Agriculture slide "Land Degradation Scenario of India-2010-11", MoEFCC Session I deck. Shares computed from the areas (area / 120.40 x 100); the slide prints 1.8% for saline soils, but 2.73 / 120.40 is 2.3%.
The global picture
The best-known figure comes from the UNCCD's Global Land Outlook 2: "Up to 40 % of the planet's land is degraded, directly affects half of humanity, threatens roughly half of global GDP (US$44 trillion)" (UNCCD, Global Land Outlook 2 release, 26 Apr 2022). FAO's own figure is different because it counts something different: "33% of soils are degraded" (FAO, World Soil Day page (read 17 Nov 2026)). Land includes vegetation and water; soils are one part of it.
The rate is fast. UNCCD's data dashboard, built from national reports of 126 countries, found that "Between 2015 and 2019, the world lost at least 100 million hectares of healthy and productive land each year, adding up to twice the size of Greenland" (UNCCD Data Dashboard release, 24 Oct 2023). FAO's SOLAW 2025 report adds where it happens: "more than 60 percent of human-induced land degradation occurs on agricultural land", even though over 60 years "global agricultural production tripled with only an 8 percent increase in agricultural land" (FAO, SOLAW 2025 release, 1 Dec 2025).
The Intergovernmental Science-Policy Platform on Biodiversity and Ecosystem Services (IPBES) assessed land degradation in 2018. It found degradation "negatively impacting the well-being of at least 3.2 billion people" and "costing more than 10 per cent of the annual global gross product in loss of biodiversity and ecosystem services"; that "Less than one quarter of the Earth's land surface remains free from substantial human impacts"; that productivity is below its natural level on "23 per cent of the global terrestrial area"; and that soil organic carbon has seen "an estimated 8 per cent loss globally (176 gigatons of carbon (Gt C))" over the past two centuries (IPBES, Land Degradation and Restoration Assessment, Summary for Policymakers (IPBES-6, March 2018)).
Don't confuse
"Up to 40% of land" is UNCCD (Global Land Outlook 2, 2022). "33% of soils" is FAO. "3.2 billion people" is IPBES (2018 assessment, approved at Medellin). Quote each with its body and year.
In the news: World Soil Day
World Soil Day is 5 December, an official international day since 2014 (FAO, World Soil Day page (read 17 Nov 2026)). The 2024 theme was "Caring for Soils: Measure, Monitor, Manage" (FAO, 9 Dec 2024). The 2025 theme was "Healthy Soils for Healthy Cities", marked by FAO in Rome; the Glinka World Soil Prize went to Prof. Ganlin Zhang and the King Bhumibol World Soil Day Award to the French Soil Science Society; FAO's Green Cities Initiative counts more than 300 cities and aims at 1,000 by 2030 (FAO, 5 Dec 2025). World Soil Day 2026 falls on 5 December 2026.
How much of India is degraded
The atlas answer: "The Desertification and Land Degradation Atlas of India (SAC 2021) indicates the current extent of land degradation to be 97.85 million hectares covering 29.77% of the geographical area of the country during 2018-19" (NAP 2023). That is a little under one-third of India (dividing back, 97.85 / 0.2977 gives a geographical area of about 328.7 Mha, computed).
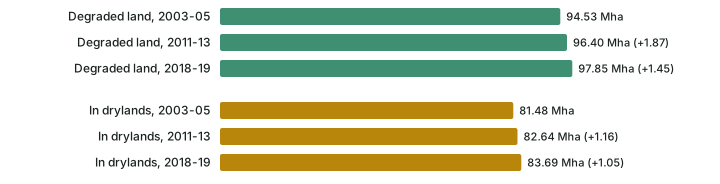
The trend is slow but upward: 94.53 Mha in 2003-05, 96.40 Mha in 2011-13 and 97.85 Mha in 2018-19, increases of 1.87 Mha and 1.45 Mha (computed; the plan itself gives 1.45 Mha, 0.44% of the geographical area, for the second step). Land undergoing desertification, that is, degradation in the drylands, rose from 81.48 to 82.64 to 83.69 Mha (NAP 2023). So in 2018-19 about 86% of all degraded land lay in the drylands (83.69 / 97.85, computed).
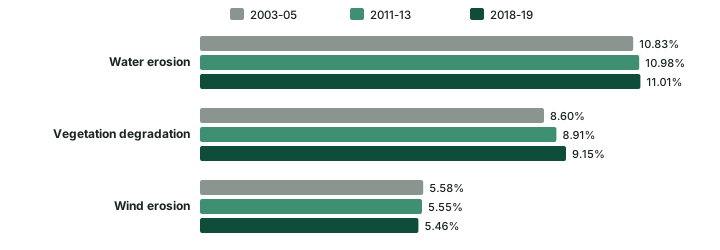
Which process does the most damage? Water erosion, then vegetation degradation, then wind erosion, measured as a share of India's total geographical area (NAP 2023). Water erosion and vegetation degradation have grown at each date; wind erosion has eased slightly.
Where
Nine states carry most of it. "Around 23.79% (2018-19) ... of the area undergoing desertification/land degradation with respect to TGA of the country" lies in Rajasthan, Maharashtra, Gujarat, Karnataka, Ladakh UT, Jharkhand, Odisha, Madhya Pradesh and Telangana, in descending order (NAP 2023). Out of the national 29.77%, that is about 80% of all India's degraded land (23.79 / 29.77, computed). Measured against their own area, more than half of Jharkhand, Rajasthan, Delhi, Gujarat and Goa is degraded, while Kerala, Assam, Mizoram, Haryana, Bihar, Uttar Pradesh, Punjab and Arunachal Pradesh have less than 10% (NAP 2023).
Exam tip
Two different measures exist. By share of India's degraded area, Rajasthan comes first (the plan lists the nine states in descending order). By share of a state's own area, five (Jharkhand, Rajasthan, Delhi, Gujarat and Goa) are more than half degraded; the plan names them without ranking them. Read the question for which measure it wants.
India's degraded land: estimates and their bases
| Series | Year | Area | Basis | Source |
|---|---|---|---|---|
| ISRO-SAC atlas | 2018-19 | 97.85 Mha (29.77%) | satellite mapping of all degradation processes | SAC (ISRO), Desertification and Land Degradation Atlas of India (2021), as reproduced in MoEFCC, National Action Plan to Combat Desertification and Land Degradation through Forestry Interventions (2023) |
| ISRO-SAC atlas | 2011-13 | 96.40 Mha | same series; the LDN baseline | SAC (ISRO), Desertification and Land Degradation Atlas of India (2021), as reproduced in MoEFCC, National Action Plan to Combat Desertification and Land Degradation through Forestry Interventions (2023) |
| ISRO-SAC atlas, drylands only | 2018-19 | 83.69 Mha | desertification (arid, semi-arid, dry sub-humid) | SAC (ISRO), Desertification and Land Degradation Atlas of India (2021), as reproduced in MoEFCC, National Action Plan to Combat Desertification and Land Degradation through Forestry Interventions (2023) |
| Ministry of Agriculture | 2010-11 | 120.40 Mha | by type, including acidic and alkaline soils | Ministry of Agriculture slide "Land Degradation Scenario of India-2010-11", MoEFCC Session I deck |
| NCERT | not dated | "about half of the total land" | "under some degree of degradation" | NCERT, India: Physical Environment, Class XI, 2020 edition, ch 6 "Soils" (dropped from the current book) |
Compiled from the sources named in each row. Never add or subtract figures from different series.
Don't confuse
97.85 Mha (2018-19) is the ISRO atlas. 120.40 Mha (2010-11) is the Ministry of Agriculture breakdown, which counts soil acidity and alkalinity too. 83.69 Mha is the drylands part of the atlas figure (desertification), not a separate total.
Conserving soil
"Soil conservation is a methodology to maintain soil fertility, prevent soil erosion and exhaustion, and improve the degraded condition of the soil" (NCERT). The action plan sorts the measures into "biological, mechanical, and bio engineering measures" (NAP 2023). Biological measures use plants and crop choices to keep the ground covered; mechanical measures reshape the land to slow the water.
Biological measures
- Mulching covers the soil and protects it "from the rain drop impact", and reduces the speed of runoff and wind (NAP 2023).
- Cover cropping, mixed cropping and crop rotation: the plan gives pulses alternated with wheat, barley or mustard as a rotation, and notes that mixed cropping is also called intercropping (NAP 2023).
- Contour farming ploughs "across the slope rather than up and downhill", so each furrow checks the water that "causes sheet, rill or gully erosion"; but on steep slopes "contour farming alone will increase gullying", so it is combined with strip cropping (NAP 2023).
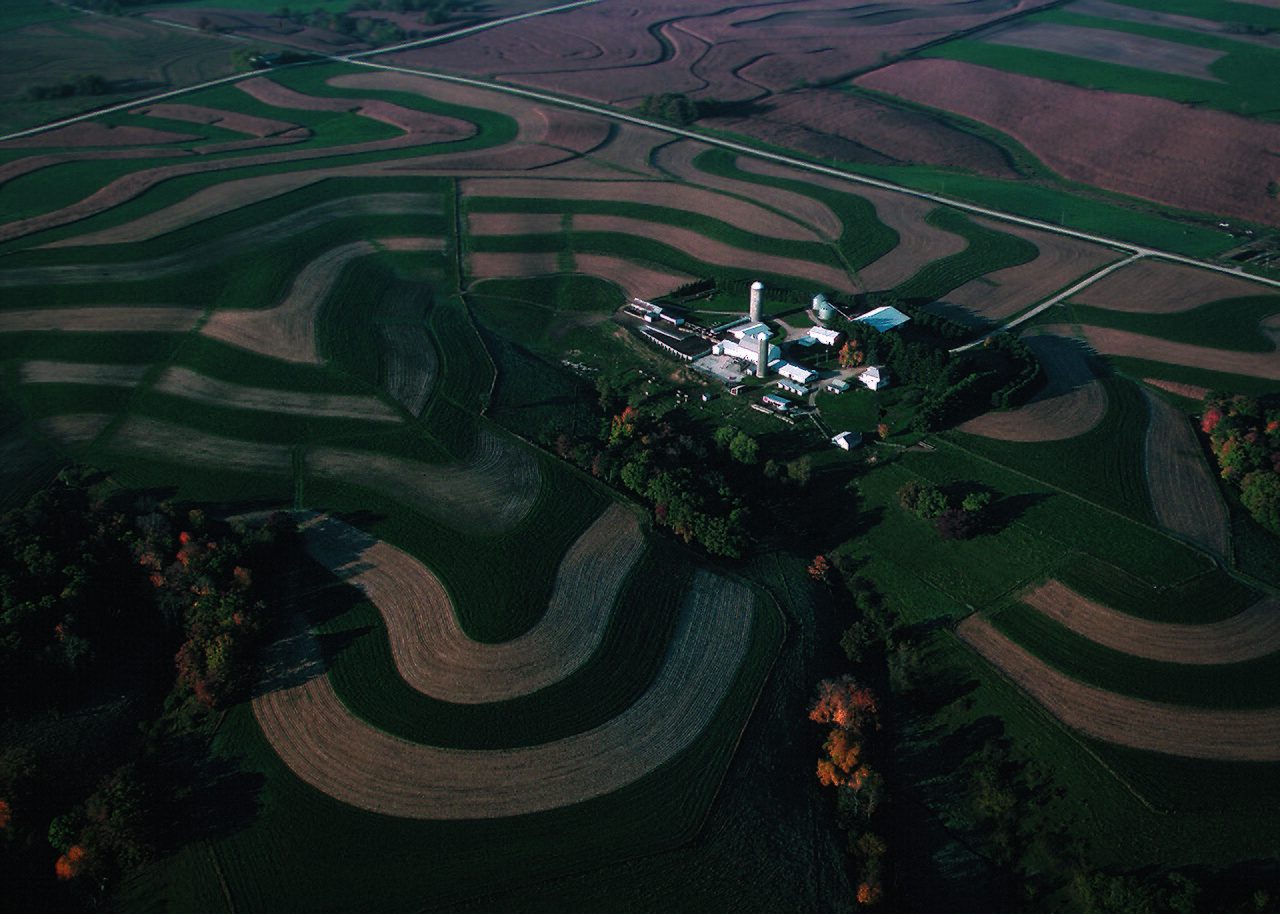
- Strip cropping lays strips "at right angles to the slope"; "soil removed from these is trapped in the next strip, which is generally planted with a leguminous or grass crop", and it "reduces soil erosion due to both water and wind erosions". Its three types are contour, field and buffer strip cropping (NAP 2023).
- Conservation tillage disturbs the soil less: no-till, strip-till, ridge-till (ridges 10-15 cm high) and mulch-till, which leaves "at least one third of the soil surface covered" (NAP 2023).
- Agroforestry and shelter belts: in arid and semi-arid areas, cultivable land is protected from sand dunes by "developing shelter belts of trees and agro-forestry"; land unfit for cultivation should become pasture (NCERT).
Mechanical measures
Mechanical measures have two purposes: "(1) to increase the time of stay of runoff water" so that more of it soaks in, and "(2) to break the land slope, thus reducing the velocity of the runoff water" (NAP 2023). The main ones are bunds and terraces. A terrace is "an earth embankment, constructed across the slope"; a bench terrace converts "a steep slope of 20 to 30 percent to a series of level, or nearly level benches" (NAP 2023). NCERT adds contour bunding and contour terracing to its list of remedies, and two firm rules for slopes:
"Lands with a slope gradient of 15 - 25 per cent should not be used for cultivation. If at all the land is to be used for agriculture, terraces should carefully be made" (NCERT). Over-grazing and shifting cultivation should be regulated by educating villagers (NCERT).
Worked example: What does a 15% slope look like?
NCERT says slopes of 15-25% should not be cultivated, and the action plan terraces slopes of 20-30%. Convert these gradients to degrees.
- A gradient in per cent is rise / run x 100. A 15% slope rises 15 m over 100 m of horizontal distance.
- Angle = arctan(rise / run). arctan(0.15) = 8.5 degrees; arctan(0.25) = 14.0 degrees.
- For the bench-terrace range: arctan(0.20) = 11.3 degrees; arctan(0.30) = 16.7 degrees.
Answer: 15-25% is only about 8.5 to 14.0 degrees. Slopes that look gentle can still be too steep to plough safely, which is why a per-cent rule is used, not a feel for steepness.
Gullies, dunes and planning
"Finger gullies can be eliminated by terracing. In bigger gullies, the erosive velocity of water may be reduced by constructing a series of check dams." The headward extension of gullies needs special care, "by gully plugging, terracing or by planting cover vegetation" (NCERT). In western Rajasthan, experiments to stabilise sand dunes have been made by the Central Arid Zone Research Institute (CAZRI) (NCERT).
The Central Soil Conservation Board, set up by the Government of India, prepared plans for different regions by climate, land configuration and the social behaviour of people, but NCERT calls them "fragmental in nature". Its answer is integrated land use planning: classify land by capability, map land use and put land to the right use; in the end "The final responsibility for achieving the conservation of land will rest on the people who operate on it" (NCERT).
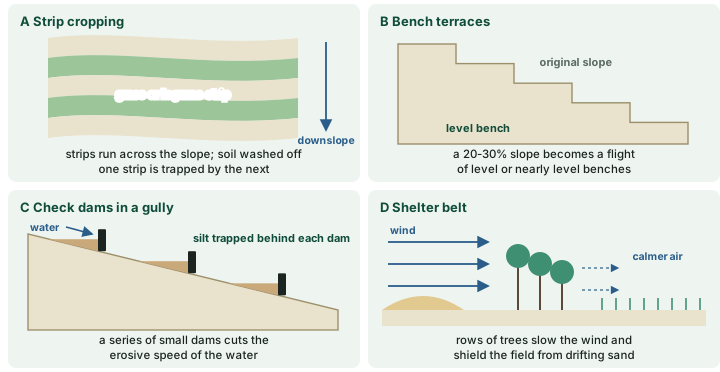
Conservation measures compared
| Measure | Type | How it works | Source |
|---|---|---|---|
| Mulching | biological | blocks raindrops; slows runoff and wind | NAP 2023 |
| Cover crops, mixed cropping, crop rotation | biological | keep the ground covered; rotation with pulses | NAP 2023; NCERT |
| Contour farming | biological | furrows across the slope check runoff | NAP 2023 |
| Strip cropping | biological | grass or legume strips trap soil from the strip above | NAP 2023 |
| Conservation tillage | biological | less disturbance; residue left on the surface | NAP 2023 |
| Shelter belts, agroforestry | biological | trees cut wind speed; protect fields from dunes | NCERT |
| Contour bunds | mechanical | earth banks along the contour hold water back | NCERT; NAP 2023 |
| Bench terraces | mechanical | turn a 20-30% slope into level benches | NAP 2023 |
| Check dams, gully plugging | mechanical | slow runoff; stop headward growth | NCERT |
| Land capability planning | planning | put each piece of land to the use it can bear | NCERT |
Compiled from NCERT (Class XI, 2020, ch 6) and MoEFCC NAP 2023; full references under the diagram above.
India's restoration commitments
Land Degradation Neutrality (LDN) is "a state whereby the amount and quality of land resources necessary to support ecosystem functions and services to enhance food security remain stable, or increase within specified temporal and spatial scales and ecosystems" (NAP 2023). It is reached through three actions taken together: "avoiding new degradation of land by maintaining existing healthy land", "reducing existing degradation by adopting sustainable land management practices" and "ramping up efforts to restore and return degraded lands to a natural or more productive state" (NAP 2023). India's LDN baseline is the 2011-13 atlas figure, 96.40 Mha (NAP 2023).
The restoration pledge grew in two steps. "In 2015, India pledged 13 million hectares to the 2020 challenge goal, with an additional 8 million hectares by 2030" under the Bonn Challenge (IUCN, 29 Jun 2026), 21 Mha in all (computed). At UNCCD COP14, which India hosted in September 2019, the goal was raised to restoration of 26 million ha of degraded land by 2030 (PIB 1727987, 17 Jun 2021; IUCN, 29 Jun 2026).
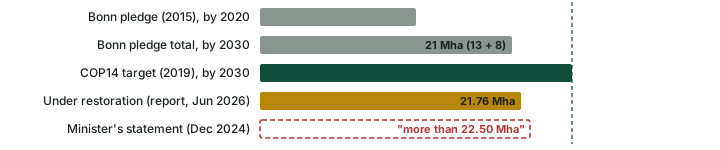
Two numbers for progress circulate, and they are not the same kind of number. At UNCCD COP16 in December 2024 the Environment Minister stated that "more than 22.50 million hectares has already been restored" (PIB 2080327, 3 Dec 2024); that is a statement. On 17 June 2026 the Ministry released India's Second Progress Report on the Bonn Challenge, "announcing 21.76 million hectares brought under restoration against the largest ever Bonn Challenge pledge of 26 million hectares", compiled from 36 States and UTs and the Department of Land Resources (IUCN, 29 Jun 2026). Use the report's figure, and note that "brought under restoration" is not the same as "restored".
In the news: Bonn Challenge report (June 2026)
India, 17 June 2026. The Second Progress Report on the Bonn Challenge put 21.76 Mha under restoration against the 26 Mha pledge (IUCN, 29 Jun 2026; see above).
Plans and programmes
On 25 March 2023 the Environment Minister unveiled the National Action Plan to Combat Desertification and Land Degradation through Forestry Interventions, the document quoted throughout this part, and launched the Aravalli Green Wall Project at Tikli, Gurugram, to "green 5 km buffer area around the Aravalli Hill Range in four states": Haryana, Rajasthan, Gujarat and Delhi, where the landscape spans "over 6 million hectares". One of its objectives is "To prevent eastward expansion of Thar Desert" (PIB 1910745, 25 Mar 2023). At the same launch the Minister restated the national goal of "an additional 2.5 billion tonnes of carbon sink by 2030": a target, not an achievement. Later releases report that India "has created an additional carbon sink of 2.29 billion tonnes of CO₂ equivalent by 2021" and has raised the goal to "3.5–4.0 billion tonnes of CO₂ equivalent by 2035, compared with 2005 levels" (PIB 2316216, 28 Sep 2026), the 2035 ambition set in India's third Nationally Determined Contribution, NDC 3.0 (2026) (PIB 2268795, 4 Jun 2026).
The Aravalli figures need care. A year-end review said the initiative "proposes restoration of 6.31 million hectares" with a phase-wise plan for 2025-2034, and that "In 2025, about 36,025 Ha area have been restored", with 435 nurseries (PIB 2210100, 31 Dec 2025). Two weeks later the Ministry said "6.45 million hectares of degraded land in the Aravalli region has been identified, with greening work initiated over 2.7 million hectares" (PIB 2214525, 14 Jan 2026). The first is the area proposed for restoration; the second is degraded land identified; neither is land restored. The range itself is described as the "700-km" Aravalli range (PIB 2133734, Jun 2025).
The Ek Ped Maa Ke Naam (Plant4Mother) campaign was launched on 5 June 2024, World Environment Day. The government reports 262.4 crore saplings planted by December 2025 (2.624 billion, computed) and "more than 3.5 billion" by September 2026 (PIB 2210100, 31 Dec 2025; PIB 2316216, 28 Sep 2026). These are self-reported counts of saplings planted, not of trees surviving.
Soil Health Cards
The Soil Health Card scheme was launched by the Prime Minister on 19 February 2015 at Suratgarh, Rajasthan (PIB backgrounder "Celebrating a Decade of Soil Health Cards", 19 Feb 2025). A card reports a farm's soil on 12 parameters: the macro-nutrients N, P, K and S; the micro-nutrients Zn, Fe, Cu, Mn and boron; and pH, electrical conductivity (EC) and organic carbon (OC) (PIB backgrounder "Celebrating a Decade of Soil Health Cards", 19 Feb 2025). Samples are taken "generally two times in a year, after harvesting of Rabi and Kharif Crop" (PIB backgrounder "Celebrating a Decade of Soil Health Cards", 19 Feb 2025), and cards come in 22 languages and 5 dialects (PIB explainer on Soil Health Cards, 16 Aug 2025).
The scale, in the government's own figures: "As of July 2025, over 25 crore Soil Health Cards have been distributed to farmers"; Rs 1,706.18 crore had been released to States and UTs by February 2025; and the Soil and Land Use Survey of India has mapped soils at 1:10,000 over nearly 290 lakh ha, including land in 40 aspirational districts, with 1,987 village-level soil fertility maps for 21 States and UTs (PIB explainer on Soil Health Cards, 16 Aug 2025). "The new system was rolled out in April 2023 and samples are now being collected through the mobile application" (PIB backgrounder "Celebrating a Decade of Soil Health Cards", 19 Feb 2025). As of 24 July 2025 the School Soil Health Programme ran in 1,021 schools, with 1,000 soil testing labs and 132,525 students enrolled (PIB explainer on Soil Health Cards, 16 Aug 2025).
Soil testing laboratories, February 2025
| Type | Number |
|---|---|
| Static laboratories | 1,068 |
| Mobile units | 163 |
| Mini laboratories | 6,376 |
| Village-level laboratories | 665 |
| Total | 8,272 |
Source: PIB explainer on Soil Health Cards, 16 Aug 2025. Total computed; it matches the 8,272 the explainer prints. The 665 village-level labs are in 17 States (PIB backgrounder "Celebrating a Decade of Soil Health Cards", 19 Feb 2025).
Remember
Since 2022-23 the scheme has been a component of the Rashtriya Krishi Vikas Yojana (RKVY), under the name "Soil Health & Fertility" (PIB backgrounder "Celebrating a Decade of Soil Health Cards", 19 Feb 2025).
Degradation processes compared
Degradation processes compared
| Process | Cause | Effect or where | Main remedy |
|---|---|---|---|
| Sheet erosion | runoff over level or gentle land | removes fine, fertile topsoil unseen | cover crops, mulching, contour farming |
| Rill and gully erosion | concentrated runoff on slopes | cuts fields apart; badlands (Chambal) | terracing, check dams, gully plugging |
| Wind erosion | wind over dry, bare, loose soil | leading process in arid western India | shelter belts, agroforestry, dune fixing |
| Vegetation degradation | deforestation, grazing, shifting cultivation | second process in the atlas | regulated forestry, controlled grazing |
| Salinisation | over-irrigation, dry climate, capillary rise | salt crust; fertility lost | drainage, gypsum (saline soils) |
| Waterlogging | excess irrigation, floods, poor drainage | roots lack air | drainage planning |
| Chemical decline | fertiliser without humus | soil hardens; fertility falls | organic matter; soil testing |
Compiled from NCERT, India: Physical Environment, Class XI, 2020 edition, ch 6 "Soils" (dropped from the current book) and MoEFCC, National Action Plan to Combat Desertification and Land Degradation through Forestry Interventions (2023).
Summary
- Soil degradation (NCERT) is loss of fertility and depth; land degradation (NAP, UNCCD) is loss of productivity of the whole land system; desertification is land degradation in the drylands.
- Water erosion runs from raindrop splash to sheet, rill and gully; India loses about 8,000 ha a year to ravines (NCERT).
- Drylands are arid, semi-arid and dry sub-humid land, with an aridity index (P / PET) from 0.05 to 0.65.
- India: 97.85 Mha, 29.77% degraded in 2018-19 (ISRO atlas), up from 96.40 and 94.53 Mha; water erosion leads; nine states hold about four-fifths of it. The 2010-11 Ministry of Agriculture breakdown gives 120.40 Mha on a different basis.
- World: up to 40% of land degraded (UNCCD, 2022); 33% of soils (FAO); 3.2 billion people harmed (IPBES, 2018).
- Conservation is biological (cover, contour, strips, tillage, shelter belts), mechanical (bunds, terraces, check dams) and planned (land capability).
- India pledged 26 Mha by 2030 (COP14, 2019); 21.76 Mha was under restoration in June 2026. Soil Health Cards: over 25 crore by July 2025, under RKVY.
Sources
Each table and data figure names its source beneath it. The main documents are collected here, with a date where the source carries one. Figures not listed under image credits were drawn for this page from the sources stated in their source lines.
Main sources
| Topic | Source |
|---|---|
| Soil degradation, erosion, badlands, conservation (textbook) | NCERT, India: Physical Environment, Class XI, 2020 edition, ch 6 "Soils" (dropped from the current book) |
| Land degradation, drylands, atlas processes and areas, conservation measures, LDN | MoEFCC, National Action Plan to Combat Desertification and Land Degradation through Forestry Interventions (2023), reproducing SAC (ISRO), Desertification and Land Degradation Atlas of India (2021) |
| Splash and rill erosion, erosion grades | FAO LADA project, Manual for Local Level Assessment of Land Degradation, Sustainable Land Management and Livelihoods, Part 2, Annex 1 |
| Atlas release; COP14 and the 26 Mha goal | PIB 1727987, 17 Jun 2021 |
| Land degradation by type, 2010-11 | Ministry of Agriculture slide "Land Degradation Scenario of India-2010-11", MoEFCC Session I deck |
| Global Land Outlook 2 | UNCCD, Global Land Outlook 2 release, 26 Apr 2022 |
| Soils degraded; World Soil Day | FAO, World Soil Day page (read 17 Nov 2026) |
| Land lost each year, 2015-2019 | UNCCD Data Dashboard release, 24 Oct 2023 |
| Degradation on agricultural land | FAO, SOLAW 2025 release, 1 Dec 2025 |
| IPBES land degradation assessment | IPBES, Land Degradation and Restoration Assessment, Summary for Policymakers (IPBES-6, March 2018) |
| Bonn Challenge pledges and the Second Progress Report | IUCN, 29 Jun 2026 |
| Minister's statement at COP16 | PIB 2080327, 3 Dec 2024 |
| Action plan launch, Aravalli Green Wall Project | PIB 1910745, 25 Mar 2023 |
| Carbon sink, Ek Ped Maa Ke Naam | PIB 2316216, 28 Sep 2026 |
| NDC 3.0 | PIB 2268795, 4 Jun 2026 |
| Aravalli year-end review, Ek Ped Maa Ke Naam | PIB 2210100, 31 Dec 2025 |
| Aravalli degraded land identified | PIB 2214525, 14 Jan 2026 |
| Aravalli range length | PIB 2133734, Jun 2025 |
| Soil Health Card scheme: launch, parameters, RKVY | PIB backgrounder "Celebrating a Decade of Soil Health Cards", 19 Feb 2025 |
| Soil Health Cards: scale, laboratories, schools | PIB explainer on Soil Health Cards, 16 Aug 2025 |
| UNCCD COP16 | UNCCD COP16 page; UNCCD COP16 closing release, 14 Dec 2024 |
| UNCCD COP17 | UNCCD COP17 closing release, 28 Aug 2026 |
| World Soil Day 2024 and 2025 | FAO, 9 Dec 2024; FAO, 5 Dec 2025 |
Image credits
| Image | Credit and licence |
|---|---|
| Severe sheet and rill erosion on highly erodible soils in Iowa after heavy rains | Lynn Betts, USDA Natural Resources Conservation Service. Public domain. File page |
| Ephemeral gully and severe rill erosion in a western Iowa corn field | Lynn Betts, USDA Natural Resources Conservation Service. Public domain. File page |
| Dust storm approaching Stratford, Texas | George Everett Marsh Jr. Public domain. File page |
| Alternating strips of alfalfa with corn on the contour, northeast Iowa | Tim McCabe, USDA Natural Resources Conservation Service. Public domain. File page |
| Terrace farming on the way to Ransi village, Garhwal, Uttarakhand | Varun Shiv Kapur. CC BY 2.0. File page |
| All other figures | Drawn for this page from the sources given in their source lines. |