 BharatNotes
Part 11 of 11 of the Atmosphere and Climatology notes. The overview page has the quick revision and exam strategy for all eleven parts.
Climate Change
Earth's climate has never stood still. Ice ages have come and gone, deserts have been wet, and Europe shivered through a "Little Ice Age". What is new is the speed of the present warming and its cause. This part follows the NCERT account of past climates and the causes of change, then brings every figure up to the latest official value, with its date and the dataset it comes from.
Cross-paper relevance
- GS1 (Geography, primary): climate through time and the astronomical and terrestrial causes of climate change
- GS3 (Environment): greenhouse gases and their global warming potentials, observed warming, the IPCC Sixth Assessment and carbon budgets, and the international response: the Kyoto Protocol, the Paris Agreement and the Kigali Amendment
Climate through time
NCERT opens with a reminder of scale: "The type of climate we experience now might be prevailing over the last 10,000 years with minor and occasionally wide fluctuations." Before that, geological records show that glacial and inter-glacial periods alternated many times.
The geological past
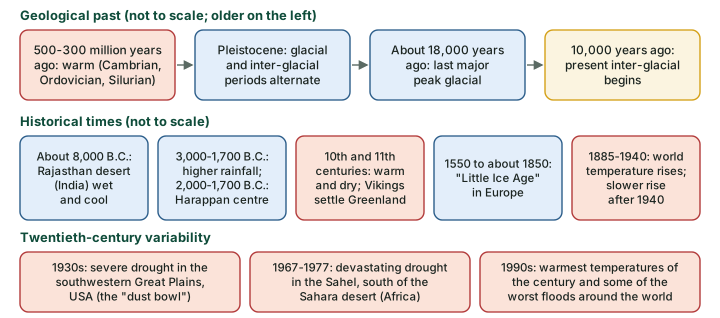
The earth was warm some 500-300 million years ago, through the Cambrian, Ordovician and Silurian periods. During the Pleistocene epoch, glacial and inter-glacial periods occurred; the last major peak glacial period was about 18,000 years ago, and the present inter-glacial period started 10,000 years ago (NCERT).
Historical times
Climate kept changing after the ice retreated. Archaeological findings show that the Rajasthan desert (India) had a wet and cool climate around 8,000 B.C. The period 3,000-1,700 B.C. had higher rainfall, and from about 2,000-1,700 B.C. the region was the centre of the Harappan civilisation; dry conditions have sharpened since then. Elsewhere, the tenth and eleventh centuries were warm and dry, the time when the Vikings settled in Greenland. Europe went through the "Little Ice Age" from 1550 to about 1850. From about 1885 to 1940 world temperature showed an upward trend, and after 1940 the rate of increase slowed down (NCERT).
Shorter swings happen all the time. NCERT gives three twentieth-century examples: the severe drought of the 1930s in the southwestern Great Plains of the United States, called the "dust bowl"; the devastating drought in the Sahel, south of the Sahara desert, from 1967 to 1977; and the 1990s, which recorded the warmest temperatures of the century and some of the worst floods around the world.
Remember
- Warm earth: 500-300 million years ago (Cambrian, Ordovician, Silurian).
- Last major peak glacial: about 18,000 years ago. Present inter-glacial: began 10,000 years ago.
- Rajasthan wet and cool around 8,000 B.C.; Harappan centre about 2,000-1,700 B.C.
- Little Ice Age in Europe: 1550 to about 1850.
Causes of climate change
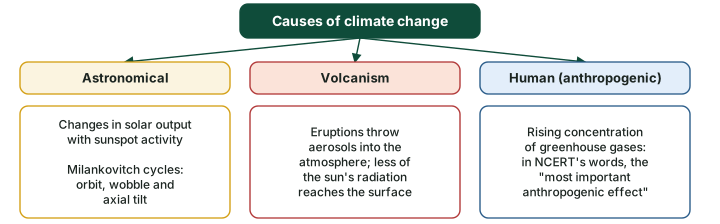
NCERT groups the causes into astronomical and terrestrial ones, and then turns to the human, or anthropogenic, effect: the rising concentration of greenhouse gases (the diagram below).
Sunspots and solar output
The astronomical causes include changes in solar output linked to sunspot activity. In NCERT's words, sunspots "are dark and cooler patches on the sun which increase and decrease in a cyclical manner". According to some meteorologists, more sunspots bring cooler and wetter weather and greater storminess, and fewer sunspots warm and drier conditions. NCERT adds at once: "Yet, these findings are not statistically significant."
The IPCC gives the size of the effect. Its Sixth Assessment Report (IPCC AR6 WG1, Chapter 7 (2021)) names the solar 11-year activity cycle as the dominant cycle, and finds that over the last three such cycles the total solar irradiance has differed by about 1 W m−2 between solar maxima and minima.
Don't confuse
NCERT reports a sunspot-weather link that "some meteorologists" see, and in the next breath says it is not statistically significant. Quote both halves; never present the link as established.
Milankovitch cycles
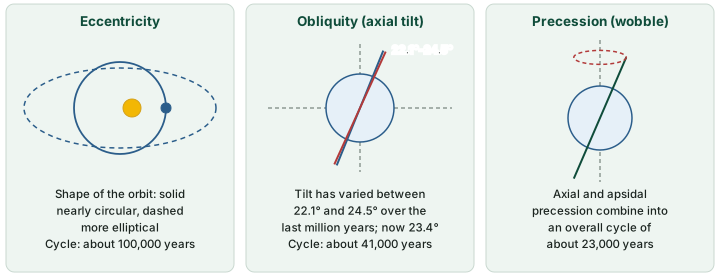
Another astronomical theory is the Milankovitch cycles (NCERT spells the name "Millankovitch"). They are cycles in the earth's orbit around the sun, in the wobbling of the earth and in the tilt of its axis, and all of them alter the amount of insolation the earth receives (NCERT). NASA gives the periods: the shape of the orbit (eccentricity) changes over a cycle of about 100,000 years; the axial tilt (obliquity) has varied between 22.1° and 24.5° over the last million years, is now 23.4°, and changes over a cycle of about 41,000 years; and axial and apsidal precession combine into an overall precession cycle of about 23,000 years on average (NASA Science, page on Milankovitch (orbital) cycles (last updated 22 Oct 2024)).
Remember
Eccentricity about 100,000 years; obliquity about 41,000 years (22.1° to 24.5°, now 23.4°); precession about 23,000 years. All three are "about" values.
Volcanism
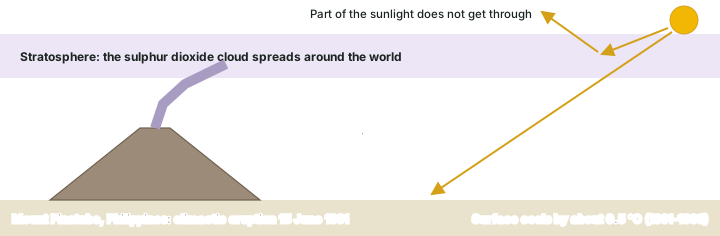
Volcanism is a terrestrial cause. An eruption throws aerosols into the atmosphere; they stay there for a considerable time and reduce the sun's radiation reaching the earth's surface. After the eruptions of Pinatubo and El Chichón (NCERT spells them "Pinatoba" and "El Cion"), the average temperature of the earth fell to some extent for some years (NCERT).
Pinatubo is the best-measured case. Its climactic eruption came on 15 June 1991, and the US Geological Survey reports: "Nearly 20 million tons of sulfur dioxide were injected into the stratosphere in Pinatubo's 1991 eruptions, and dispersal of this gas cloud around the world caused global temperatures to drop temporarily (1991 through 1993)" by about 0.5 °C (USGS Fact Sheet 113-97, "The Cataclysmic 1991 Eruption of Mount Pinatubo, Philippines").
Why it happens
An eruption cools rather than warms because the aerosols it lifts reduce the sunlight that reaches the surface (NCERT). The effect is temporary: for Pinatubo it lasted from 1991 through 1993 (USGS).
The human cause
"The most important anthropogenic effect on the climate is the increasing trend in the concentration of greenhouse gases in the atmosphere which is likely to cause global warming," says NCERT. The IPCC has since gone further.
Key idea: the IPCC verdict
"It is unequivocal that human influence has warmed the atmosphere, ocean and land." (IPCC AR6 WG1, Summary for Policymakers (August 2021), headline statement A.1)
Greenhouse gases
The name comes from the greenhouses used in cold areas to keep plants warm. NCERT explains that the glass is transparent to incoming short-wave solar radiation but opaque to outgoing long-wave radiation, so heat builds up inside. NCERT adds an everyday example: a car or bus with its windows closed feels hotter than the air outside in summer. The gases that do this for the whole atmosphere are the greenhouse gases (GHGs). The insolation and heat budget part explains the greenhouse effect and the earth's energy budget in detail.
NCERT lists the primary GHGs of concern as carbon dioxide (CO2), chlorofluorocarbons (CFCs), methane (CH4), nitrous oxide (N2O) and ozone (O3); nitric oxide (NO) and carbon monoxide (CO) easily react with GHGs and change their concentration. How effective a GHG molecule is depends on how much its concentration rises, how long it lasts in the atmosphere and the wavelength of radiation it absorbs. CFCs are highly effective.
Carbon dioxide
CO2 has the largest concentration of all the GHGs. It comes mainly from burning fossil fuels (oil, gas and coal). Forests and oceans are its sinks; forests use it in their growth, so deforestation due to changes in land use also raises its concentration. The atmosphere takes 20-50 years to adjust to a change in sources or sinks (NCERT). NCERT also states: "It is rising at about 0.5 per cent annually." That rate is now out of date (see the worked example below).
The latest global values come from the WMO Greenhouse Gas Bulletin No. 22 (27 October 2026), which reports 2025 means from the WMO Global Atmosphere Watch network: CO2 426.8 ± 0.2 ppm, CH4 1,948 ± 2 ppb and N2O 339.1 ± 0.1 ppb (ppm and ppb are parts per million and per billion). The Bulletin describes these as "increases of 53%, 167% and 26% above pre-industrial (before 1750) levels". CO2 rose by 2.8 ppm from 2024 to 2025, and it accounts for "approximately 66%" of the radiative forcing by long-lived greenhouse gases, with methane at "about 16%".
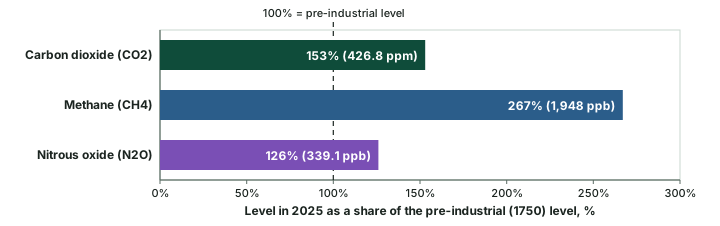
Greenhouse gases in 2025 (WMO Global Atmosphere Watch)
| Gas | 2025 global mean | Share of the 1750 level | Note |
|---|---|---|---|
| Carbon dioxide (CO2) | 426.8 ± 0.2 ppm | 153% | "approximately 66%" of the forcing by long-lived GHGs; rose 2.8 ppm in 2024-25 |
| Methane (CH4) | 1,948 ± 2 ppb | 267% | "about 16%" of that forcing |
| Nitrous oxide (N2O) | 339.1 ± 0.1 ppb | 126% | In NCERT's list of primary GHGs |
Source: WMO Greenhouse Gas Bulletin No. 22 (27 October 2026). The shares of the 1750 level restate the Bulletin's "increases of 53%, 167% and 26%".
Worked example: How fast is carbon dioxide rising now?
NCERT says carbon dioxide is rising at about 0.5 per cent a year. Check this against the WMO Greenhouse Gas Bulletin No. 22: the 2025 mean is 426.8 ppm, 2.8 ppm above 2024.
- 2024 level = 426.8 − 2.8 = 424.0 ppm.
- Rate = 2.8 ÷ 424.0 × 100 = 0.66% a year.
- Cross-check with NOAA's own network: its global growth for 2025 was 2.06 ppm on a 2024 global mean of 422.79 ppm, or 0.49% (computed).
Answer: About 0.66% a year in 2024-25 (computed), higher than NCERT's 0.5 per cent. Each network gives a slightly different value, so name the network with the number.
The Mauna Loa record
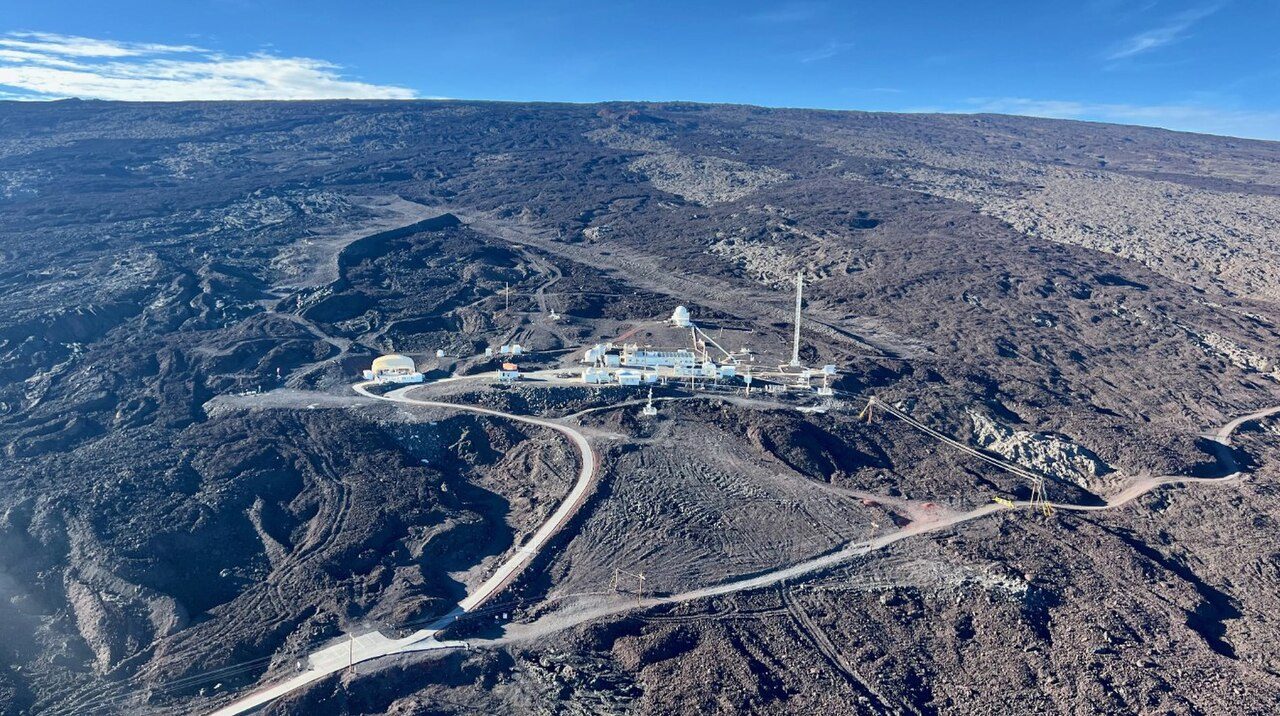
The longest direct record of CO2 comes from Mauna Loa, where the record in the NOAA file begins in March 1958 (the chart below). The red curve removes the seasonal swing; the blue one keeps it. The first monthly mean at or above 430 ppm came in May 2025 (430.51 ppm), the highest so far in May 2026 (432.34 ppm), and the latest month in the file, September 2026, stood at 426.07 ppm (NOAA GML, Mauna Loa (Scripps data before May 1974)).
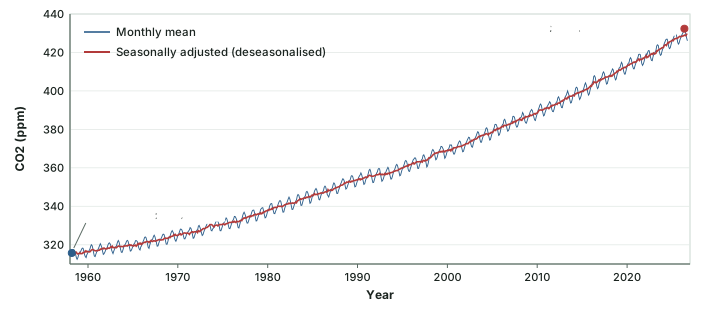
Three numbers for carbon dioxide in 2025 are all correct, because they measure different things. The table below sets them side by side.
Carbon dioxide: three networks, three numbers
| Measure | Value | Network and source |
|---|---|---|
| Global mean, 2025 | 426.8 ± 0.2 ppm | WMO Global Atmosphere Watch (WMO Greenhouse Gas Bulletin No. 22 (27 October 2026)) |
| Global marine-surface mean, 2025 | 425.62 ppm | NOAA GML |
| Mauna Loa annual mean, 2025 | 427.35 ppm (2024: 424.61 ppm) | NOAA GML |
| Rise, 2024 to 2025 | 2.8 ppm | WMO Global Atmosphere Watch |
| Annual growth, 2025 | 2.06 ppm (global); 2.23 ppm (Mauna Loa) | NOAA GML |
| Annual growth, 2024 | 3.76 ppm (global), a record in that series | NOAA GML |
| Highest monthly mean | 432.34 ppm, May 2026 | NOAA GML, Mauna Loa |
| Latest month in the file | 426.07 ppm, September 2026 | NOAA GML, Mauna Loa |
Source: WMO Greenhouse Gas Bulletin No. 22 (27 October 2026); NOAA GML, Mauna Loa (Scripps data before May 1974) (annual, growth-rate and monthly files, downloaded 18 November 2026).
Global warming potential
Gases differ in strength. The IPCC compares them through the global warming potential (GWP), with CO2 set at 1, over a 20-year and a 100-year horizon. Fossil methane scores 82.5 over 20 years but 29.8 over 100. NCERT makes a related point: the longer a GHG molecule stays in the atmosphere, the longer the atmospheric system takes to recover from the change it brings about.
Global warming potentials in IPCC AR6
| Gas | GWP-20 | GWP-100 |
|---|---|---|
| Carbon dioxide (CO2) | 1 | 1 |
| Methane, fossil | 82.5 ± 25.8 | 29.8 ± 11 |
| Methane, non-fossil | 79.7 ± 25.8 | 27.0 ± 11 |
| Nitrous oxide (N2O) | 273 ± 118 | 273 ± 130 |
Source: IPCC AR6 WG1, Chapter 7 (2021), Table 7.15.
Ozone and the CFCs
NCERT also explains that CFCs which drift into the stratosphere destroy ozone, that large depletion occurs over Antarctica, and that this depletion, called the ozone hole, allows ultraviolet rays to pass through the troposphere. The composition and structure part covers the ozone layer, the Montreal Protocol and its Kigali Amendment.
Observed warming
What the textbook says
NCERT puts the annual average near-surface air temperature of the world at approximately 14 °C. It describes the twentieth century as follows: the greatest warming came in two periods, 1901-44 and 1977-99, with global temperatures rising by about 0.4 °C in each; in between there was a slight cooling, more marked in the northern hemisphere; and at the end of the century the global mean was about 0.6 °C above that at the end of the nineteenth. NCERT's last lines are dated: "The seven warmest years during the 1856-2000 were recorded in the last decade. The year 1998 was the warmest year, probably not only for the 20th century but also for the whole millennium." That was true when it was written. It is no longer the record: on the HadCRUT5 series in the chart below, 1998 now ranks 18th (computed).
The latest official figures
The WMO's State of the Global Climate 2025 (press release, 23 March 2026) reports that 2025 was "the second or third warmest year (depending on the dataset)", at "about 1.43 ± 0.13 °C above the 1850–1900 pre-industrial average". The year 2024 "remains the warmest year, at about 1.55 °C above the 1850–1900 average", and 2015-2025 are "the eleven warmest years on record". The same report says that the earth's energy imbalance "reached a new high in 2025", that "More than 91% of the excess heat is stored in the ocean", and that sea level is "around 11 cm higher than at the start of the satellite altimetry record in 1993".
The European Copernicus Climate Change Service (C3S), ERA5, release of 14 January 2026 uses a single dataset, ERA5, and its values run a little higher: 1.47 °C for 2025 and 1.60 °C for 2024 above 1850-1900. On ERA5, "Global temperatures from the past three years (2023-2025) averaged more than 1.5°C above the pre-industrial level (1850–1900). This marks the first time a three-year period has exceeded the 1.5°C limit." C3S puts the current level of long-term warming at "around 1.4°C".
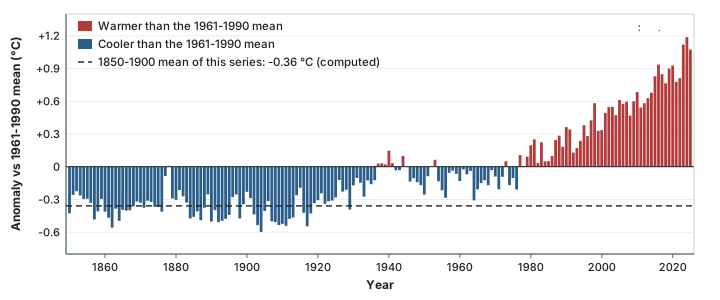
Worked example: Changing the baseline
The HadCRUT5 chart above gives 2024 as +1.19 °C against the 1961-1990 mean. How warm was it against 1850-1900 on the same series?
- Mean anomaly of 1850-1900 on this series = -0.36 °C (computed from the 51 annual values).
- 2024 against 1850-1900 = +1.19 − (-0.36) = 1.55 °C (computed).
Answer: About 1.55 °C on HadCRUT5 alone. The WMO figure of about 1.55 °C draws on several datasets, so the two need not match. Never put a 1961-1990 anomaly beside a 1850-1900 one without saying so.
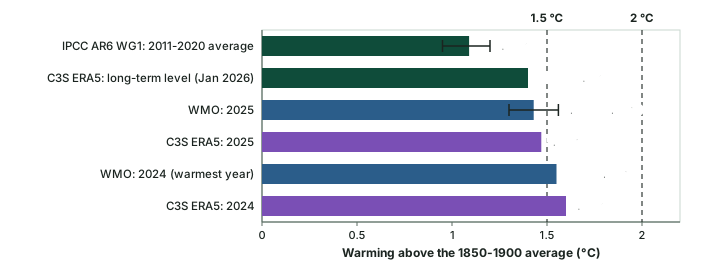
Warming figures and the baseline each one uses
| Figure | Value | Baseline | Source and date |
|---|---|---|---|
| End of 20th century | about 0.6 °C | End of the 19th century | NCERT (Reprint 2026-27) |
| 2011-2020 average | 1.09 [0.95 to 1.20] °C (land 1.59, ocean 0.88) | 1850-1900 | IPCC AR6 WG1, August 2021 |
| 2011-2020 | 1.1 °C | 1850-1900 | IPCC AR6 Synthesis Report, 2023 |
| 2024 | about 1.55 °C (warmest year) | 1850-1900 | WMO, 23 March 2026 |
| 2025 | about 1.43 ± 0.13 °C | 1850-1900 | WMO, 23 March 2026 |
| 2024; 2025 | 1.60 °C; 1.47 °C | 1850-1900 | Copernicus ERA5, 14 January 2026 |
| Long-term level | around 1.4 °C | 1850-1900 | Copernicus ERA5, 14 January 2026 |
| 2024 (warmest in the series) | +1.19 °C | 1961-1990 | HadCRUT.5.2.0.0 |
Source: NCERT, Fundamentals of Physical Geography, Class XI, ch 11 "World Climate and Climate Change" (Reprint 2026-27); IPCC AR6 WG1, Summary for Policymakers (August 2021); IPCC AR6 Synthesis Report, Summary for Policymakers (2023); WMO, State of the Global Climate 2025 (press release, 23 March 2026); Copernicus Climate Change Service (C3S), ERA5, release of 14 January 2026; Data: Met Office Hadley Centre, HadCRUT.5.2.0.0 (Open Government Licence v3).
Don't confuse
A single year above 1.5 °C (2024, about 1.55 °C on the WMO figure) is not the same as missing the Paris goal. In the WMO's words, "The 1.5°C (and 2.0°C) levels specified in the Paris Agreement refer to long-term warming sustained over an extended period, typically assessed over 20 years." (WMO decadal climate update for 2026-2030 (news release, 28 May 2026))
The IPCC's Sixth Assessment
The Working Group I report of the Sixth Assessment (IPCC AR6 WG1, Summary for Policymakers (August 2021)) found that global surface temperature was 1.09 °C higher in 2011-2020 than in 1850-1900, within a range of 0.95 to 1.20 °C, with land warming more (1.59 °C) than the ocean (0.88 °C). In 2019 the concentrations were 410 ppm of carbon dioxide, 1866 ppb of methane and 332 ppb of nitrous oxide. The Synthesis Report (IPCC AR6 Synthesis Report, Summary for Policymakers (2023)) put it in one line: "Human activities, principally through emissions of greenhouse gases, have unequivocally caused global warming, with global surface temperature reaching 1.1°C above 1850-1900 in 2011-2020". It adds that carbon dioxide in 2019 was "higher than at any time in at least 2 million years".
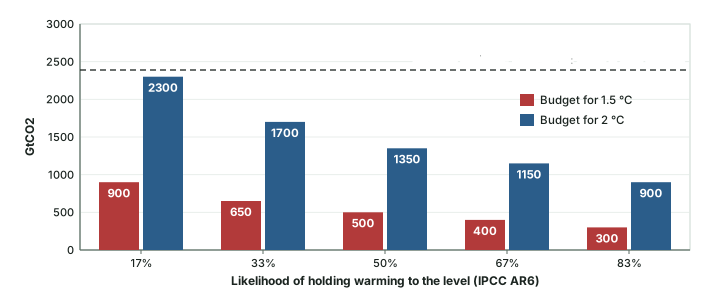
AR6 also links warming to cumulative emissions. It assesses that each 1000 GtCO2 of cumulative carbon dioxide emissions is likely to cause 0.27 °C to 0.63 °C of warming, with a best estimate of 0.45 °C. From 1850 to 2019, human activity emitted 2390 ± 240 GtCO2. What remains from the start of 2020 is the carbon budget: for a 50% chance of holding warming to 1.5 °C it was 500 GtCO2, and for 2 °C, 1350 GtCO2 (the chart below).
Remember
"It is unequivocal that human influence has warmed" is the Working Group I wording (2021); "unequivocally caused global warming" is the Synthesis Report wording (2023). AR6 (2021-23) is the latest completed IPCC assessment; the seventh cycle is under way and no AR7 report had been published by 18 November 2026 (IPCC document on progress with the AR7 timeline).
The international response
The Kyoto Protocol
NCERT describes the Kyoto Protocol as "proclaimed in 1997", in effect from 2005 and "ratified by 141 nations", binding "the 35 industrialised countries to reduce their emissions by the year 2012 to 5 per cent less than the levels prevalent in the year 1990". The counts are NCERT's. The treaty record is more exact (UN Audiovisual Library of International Law, introductory note to the Kyoto Protocol): the Protocol was adopted "at the third meeting of the COP in Kyoto on 11 December 1997", and "It entered into force on 16 February 2005". Its goal was to reduce emissions from Annex I Parties "by at least 5 per cent below the 1990 levels within the commitment period from 2008 to 2012". So the target applied over the five years 2008-2012, not to the single year 2012.
The Paris Agreement
The Paris Agreement, dated Paris, 12 December 2015, sets its temperature goal in Article 2.1(a) (Paris Agreement, UN Treaty Collection text (Paris, 12 December 2015)): "(a) Holding the increase in the global average temperature to well below 2°C above pre-industrial levels and pursuing efforts to limit the temperature increase to 1.5°C above pre-industrial levels, recognizing that this would significantly reduce the risks and impacts of climate change;"
The Kigali Amendment to the Montreal Protocol, on hydrofluorocarbons, is covered in the composition and structure part. It entered into force on 1 January 2019 (see that part); India ratified it on 27 September 2021, and it entered into force for India on 26 December 2021 (UN depositary notification C.N.282.2021).
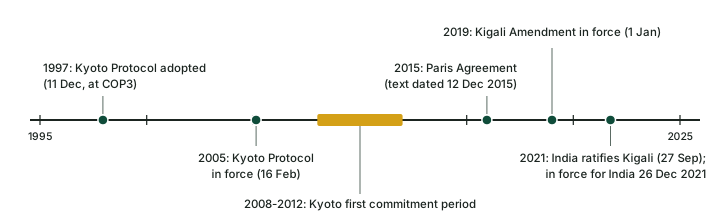
Kyoto and Paris compared
| Kyoto Protocol | Paris Agreement | |
|---|---|---|
| Date | Adopted 11 December 1997 (COP3, Kyoto); in force 16 February 2005 | Text dated Paris, 12 December 2015 |
| Goal | Annex I emissions at least 5% below 1990 levels | Warming well below 2 °C, with efforts to limit it to 1.5 °C, above pre-industrial levels |
| Period | 2008-2012 commitment period | Long-term warming (about 20 years, per WMO) |
| In NCERT | "proclaimed in 1997"; "141 nations"; "35 industrialised countries" | - |
Source: UN Audiovisual Library of International Law, introductory note to the Kyoto Protocol; Paris Agreement, UN Treaty Collection text (Paris, 12 December 2015); WMO decadal climate update for 2026-2030 (news release, 28 May 2026); NCERT, Fundamentals of Physical Geography, Class XI, ch 11 "World Climate and Climate Change" (Reprint 2026-27).
The next five years
The WMO decadal climate update for 2026-2030 (news release, 28 May 2026) predicts annual global temperatures of 1.3 °C to 1.9 °C above 1850-1900 for each year from 2026 to 2030. It gives a 91% chance that at least one of those years will temporarily exceed 1.5 °C, and a separate 75% chance that the 2026-2030 five-year mean will exceed 1.5 °C. It also gives an 86% chance that one of the years will surpass 2024 as the warmest, and under 1% that any single year will exceed 2 °C.
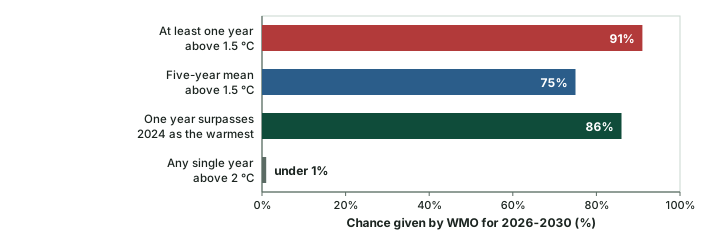
Hypothesis, not settled fact
Two statements are forecasts, not events: the WMO probabilities for 2026-2030 (WMO decadal climate update for 2026-2030 (news release, 28 May 2026)), and Copernicus's estimate that "Based on the current rate of warming, the Paris Agreement's limit of 1.5°C for long-term global warming could be reached by the end of this decade" (Copernicus Climate Change Service (C3S), ERA5, release of 14 January 2026). Write "could" and "predicts", never "will".
Exam tip
With every warming figure, give three things: the dataset or body (WMO, Copernicus ERA5, HadCRUT5, IPCC), the baseline (1850-1900 or 1961-1990) and the date of the release.
Summary
- Today's type of climate may have prevailed for about 10,000 years; the last major peak glacial was about 18,000 years ago (NCERT).
- Causes: sunspots (a link NCERT calls not statistically significant), Milankovitch cycles of about 100,000, 41,000 and 23,000 years (NASA), volcanism (Pinatubo cooled the globe by about 0.5 °C in 1991-1993, USGS) and, above all, greenhouse gases.
- 2025 global means (WMO Global Atmosphere Watch): CO2 426.8 ppm, CH4 1,948 ppb, N2O 339.1 ppb; CO2 is now rising about 0.66% a year (computed), not NCERT's 0.5 per cent.
- 2024 is the warmest year on record (about 1.55 °C above 1850-1900, WMO); 2015-2025 are the eleven warmest years.
- AR6: human activities have "unequivocally caused global warming" (Synthesis Report, 2023); 1.09 °C for 2011-2020; a 500 GtCO2 budget from 2020 for a 50% chance of 1.5 °C.
- Kyoto: adopted 11 December 1997, in force 16 February 2005, 2008-2012 period. Paris: well below 2 °C, pursuing 1.5 °C.
NCERT's lines and the latest official values
| NCERT says | Latest official value | Source |
|---|---|---|
| Carbon dioxide "is rising at about 0.5 per cent annually" | About 0.66% in 2024-25 (2.8 ppm on 424.0 ppm, computed) | WMO GHG Bulletin 22, 27 October 2026 |
| "The year 1998 was the warmest year" | 2024 is the warmest, about 1.55 °C above 1850-1900 | WMO, 23 March 2026 |
| Seven warmest years of 1856-2000 in the last decade | 2015-2025 are the eleven warmest years on record | WMO, 23 March 2026 |
| End of 20th century about 0.6 °C above end of 19th | 2011-2020: 1.09 °C above 1850-1900 | IPCC AR6 WG1, August 2021 |
| Kyoto cut "by the year 2012" | At least 5% below 1990 over 2008-2012 | UN Audiovisual Library of International Law |
| "Millankovitch", "Pinatoba", "El Cion" | Milankovitch, Pinatubo, El Chichón | Spelling |
Source: NCERT, Fundamentals of Physical Geography, Class XI, ch 11 "World Climate and Climate Change" (Reprint 2026-27); WMO Greenhouse Gas Bulletin No. 22 (27 October 2026); WMO, State of the Global Climate 2025 (press release, 23 March 2026); IPCC AR6 WG1, Summary for Policymakers (August 2021); UN Audiovisual Library of International Law, introductory note to the Kyoto Protocol.
Pairs to keep apart
| Pair | How to tell them apart |
|---|---|
| Astronomical vs terrestrial causes | Sun and orbit vs volcanism (NCERT's grouping) |
| One year above 1.5 °C vs the Paris 1.5 °C goal | A single year vs long-term warming, typically assessed over 20 years (WMO) |
| 91% vs 75% (WMO, 2026-2030) | At least one year above 1.5 °C vs the five-year mean above it |
| 1961-1990 vs 1850-1900 baseline | HadCRUT anomalies vs WMO, IPCC and Copernicus figures |
| WMO vs NOAA carbon dioxide | Global Atmosphere Watch 426.8 ppm vs NOAA marine 425.62 ppm or Mauna Loa 427.35 ppm (2025) |
| GWP-20 vs GWP-100 | Fossil methane 82.5 vs 29.8 (AR6) |
| WG1 (2021) vs Synthesis (2023) | "unequivocal" human influence vs "unequivocally caused" |
| Ozone hole vs greenhouse effect | Ultraviolet passing through the troposphere vs long-wave radiation trapped (NCERT) |
Source: NCERT, Fundamentals of Physical Geography, Class XI, ch 11 "World Climate and Climate Change" (Reprint 2026-27); WMO decadal climate update for 2026-2030 (news release, 28 May 2026); WMO Greenhouse Gas Bulletin No. 22 (27 October 2026); NOAA GML, Mauna Loa (Scripps data before May 1974); IPCC AR6 WG1, Chapter 7 (2021); IPCC AR6 WG1, Summary for Policymakers (August 2021); IPCC AR6 Synthesis Report, Summary for Policymakers (2023).
Sources
Each table and data figure names its source beneath it. The main documents are collected here, with a date where the source carries one. Figures not listed under image credits were drawn for this page from the sources stated in their source lines.
Main sources
Image credits
| Image | Credit and licence |
|---|---|
| The Mauna Loa Observatory on the north flank of Mauna Loa, Hawaii | Brian Vasel/NOAA. Public domain, via Wikimedia Commons. File page |
| All other figures | Drawn for this page from the sources given in their source lines. |