 BharatNotes
Part 1 of 11 of the Atmosphere and Climatology notes. The overview page has the quick revision and exam strategy for all eleven parts.
Composition and Structure of the Atmosphere
The atmosphere is the thin envelope of gases held to the Earth by gravity. It supplies the oxygen we breathe and the carbon dioxide plants need, it filters the Sun's harmful ultraviolet rays, and it is where all weather happens. This part takes it apart twice: first by what it is made of, then by how it is layered from the ground to the edge of space. It ends with the ozone layer, the damage done to it, and the treaties that are repairing it.
Cross-paper relevance
- GS1 (Geography, primary): the composition of the atmosphere, its five layers, the ionosphere and the ozone layer
- GS3 (Environment): the rise of carbon dioxide, methane and nitrous oxide; ozone depletion and the Antarctic ozone hole; the Montreal Protocol and the Kigali Amendment, with India's HFC phase-down schedule
What the atmosphere is
In NCERT's words, the "atmosphere is a mixture of different gases and it envelopes the earth all round". It is colourless and odourless, and we feel it only when it moves as wind. It is also remarkably shallow: "99 per cent of the total mass of the atmosphere is confined to the height of 32 km from the earth's surface" (NCERT).
NCERT names the elements of the atmosphere "which are subject to change and which influence human life on earth": temperature, pressure, winds, humidity, clouds and precipitation. The state of these elements at a given time is the weather; their long-run pattern is the climate (the world climates part develops the distinction). Parts 5.2 to 5.9 take each element in turn.
Remember
NCERT's three components of the atmosphere: gases, water vapour and dust particles. Its six elements of weather and climate: temperature, pressure, winds, humidity, clouds, precipitation.
Composition: gases, water vapour and dust
The gases of dry air
Take a sample of air, remove the water vapour, and two gases make up almost all of it: nitrogen (N2) at 78.08 per cent by volume and oxygen (O2) at 20.95 per cent. Argon, an inert gas, adds 0.934 per cent (NASA Earth Fact Sheet). Together these three come to 99.964 per cent (computed). Everything else, including carbon dioxide, is a trace gas, measured in parts per million (ppm) or parts per billion (ppb) rather than in per cent.
Trace does not mean unimportant. Carbon dioxide was about 426.8 ppm in 2025 (WMO global mean), which is only 0.043 per cent of the air (computed), yet it is one of the gases that control the Earth's temperature. NCERT explains why: CO2 "is transparent to the incoming solar radiation but opaque to the outgoing terrestrial radiation". It lets sunlight in and holds back part of the heat the Earth sends out, so it "is largely responsible for the green house effect" (see the insolation and heat budget part). Methane and nitrous oxide work the same way.
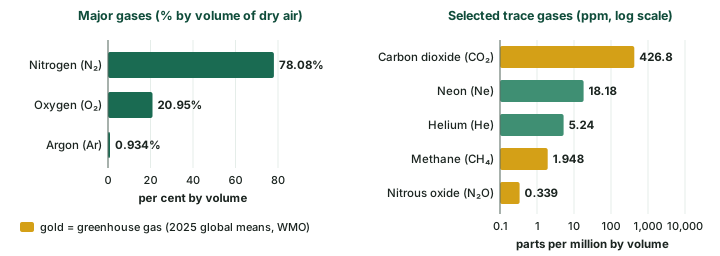
The composition of dry air
| Gas | Share by volume | Basis and date | Why it matters |
|---|---|---|---|
| Nitrogen (N2) | 78.08% | NASA Earth Fact Sheet | mostly inert; dilutes oxygen |
| Oxygen (O2) | 20.95% | NASA Earth Fact Sheet | breathing, burning; the raw material of ozone |
| Argon (Ar) | 0.934% (9,340 ppm) | NASA Earth Fact Sheet | inert gas |
| Carbon dioxide (CO2) | 426.8 ± 0.2 ppm | WMO global mean, 2025 | greenhouse gas; rising (see below) |
| Neon (Ne) | 18.18 ppm | NASA Earth Fact Sheet | inert gas |
| Helium (He) | 5.24 ppm | NASA Earth Fact Sheet | light gas |
| Methane (CH4) | 1,948 ± 2 ppb | WMO global mean, 2025 | greenhouse gas; rising |
| Nitrous oxide (N2O) | 339.1 ± 0.1 ppb | WMO global mean, 2025 | greenhouse gas; rising |
| Water vapour | up to 4% in the warm, wet tropics; under 1% in deserts and polar areas | NCERT | not part of dry air; varies most of all |
Source: NASA Earth Fact Sheet; WMO Greenhouse Gas Bulletin No. 22 (27 October 2026); NCERT, Fundamentals of Physical Geography, Class XI, ch 7 "Composition and Structure of Atmosphere" (Reprint 2026-27).
Permanent and variable gases
The gases fall into two groups. Permanent gases (nitrogen, oxygen, argon and the other inert gases) keep nearly the same proportions everywhere in the lower atmosphere. Variable gases change from place to place or year to year: water vapour, ozone, and the greenhouse gases carbon dioxide, methane and nitrous oxide. NCERT puts it this way: "The volume of other gases is constant but the volume of carbon dioxide has been rising in the past few decades mainly because of the burning of fossil fuels." The WMO's 2025 means put CO2 at 153 per cent, methane at 267 per cent and nitrous oxide at 126 per cent of their pre-industrial (before 1750) levels.
The mixture also changes with height. NCERT notes that the proportion of gases changes in the higher layers: "oxygen will be almost in negligible quantity at the height of 120 km", and "carbon dioxide and water vapour are found only up to 90 km from the surface of the earth". Below those heights the air is well stirred; above them the gases thin out at different rates.
Water vapour
Water vapour is the most variable gas of all. NCERT: "In the warm and wet tropics, it may account for four per cent of the air by volume, while in the dry and cold areas of desert and polar regions, it may be less than one per cent of the air." It decreases with height and from the equator towards the poles. NASA puts "about 99 percent of all water vapor and aerosols" in the troposphere, the lowest layer.
Small as it is, water vapour does three big jobs. It absorbs part of the incoming sunlight and holds back the heat the Earth radiates, so it "acts like a blanket allowing the earth neither to become too cold nor too hot" (NCERT). It is the raw material of clouds and rain, and NCERT adds that it "contributes to the stability and instability" of the atmosphere (see the water in the atmosphere part).
Dust particles and aerosols
The air also carries solid specks. NCERT lists "sea salts, fine soil, smoke-soot, ash, pollen, dust and disintegrated particles of meteors". They gather in the lower layers, although "convectional air currents may transport them to great heights". There are more of them over the subtropical and temperate belts, where dry winds lift dust, than over the equatorial and polar regions. Their key role is in cloud-making: dust and salt particles act as hygroscopic nuclei, the tiny surfaces on which water vapour condenses into cloud droplets (see the water in the atmosphere part).
Don't confuse
Water vapour is a gas and is invisible. Clouds, fog and mist are liquid droplets or ice crystals that have already condensed out of the vapour. Dust and salt particles are neither: they are the solid nuclei on which the droplets form.
The rise of carbon dioxide
The longest direct record of CO2 comes from NOAA's Mauna Loa Observatory, where monthly measurements begin in March 1958; NOAA's file credits the data from March 1958 through April 1974 to C. David Keeling of the Scripps Institution of Oceanography, and the plot is widely called the Keeling curve (see the chart below). It shows two things at once: a steady climb, and a yearly wiggle laid on top of it.
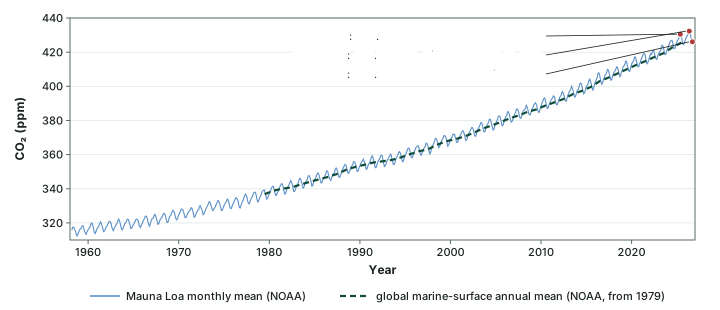
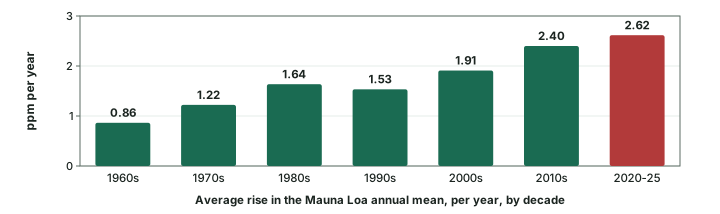
The climb. The Mauna Loa annual mean was 315.98 ppm in 1959 and 427.35 ppm in 2025 (NOAA). The monthly mean first passed 430 ppm in May 2025 (430.51 ppm), and the highest month so far is May 2026 (432.34 ppm). The climb is also getting steeper. Averaged over each decade, the annual mean rose about 0.86 ppm a year in the 1960s, 1.53 ppm a year in the 1990s and 2.40 ppm a year in the 2010s; from 2019 to 2025 it rose 2.62 ppm a year (all computed from NOAA's annual means; see the bar chart below).
The wiggle. Within each year the line rises and falls. In every year from 2016 to 2025 the Mauna Loa monthly mean peaked in May or June (May in 9 of the 10 years) and was lowest in September or October (computed from the NOAA file). The latest month in the file, September 2026, read 426.07 ppm, lower than May only because of this seasonal swing, not because the rise has stopped.
Don't confuse: Which CO₂ number?
Three official numbers for 2025 CO2, each with its own basis:
- 427.35 ppm: annual mean at Mauna Loa, one station (NOAA).
- 425.62 ppm: NOAA's global mean from marine-surface sites.
- 426.8 ± 0.2 ppm: WMO global mean from the Global Atmosphere Watch network (Greenhouse Gas Bulletin No. 22, 27 October 2026).
Quote each number with its source. For a world figure, use the WMO global mean.
Latest values (WMO, October 2026)
The WMO Greenhouse Gas Bulletin No. 22 (27 October 2026) reports that CO2, methane and nitrous oxide all reached new highs in 2025: CO2 426.8 ppm, methane 1,948 ppb and nitrous oxide 339.1 ppb. CO2 rose 2.8 ppm from 2024 to 2025, and stood at 153 per cent of its pre-industrial level of 278.3 ppm. The climate change part takes up what this means for the climate.
Do the numbers
From ppm to per cent: 1 per cent = 10,000 ppm, so 426.8 ppm = 426.8 ÷ 10,000 = 0.0427 per cent. How far above pre-industrial? 426.8 ÷ 278.3 = 153 per cent of the 1750 level, which matches the WMO's figure of 153%. A year's rise at Mauna Loa: 427.35 − 424.61 = 2.74 ppm (2024 to 2025).
The structure of the atmosphere
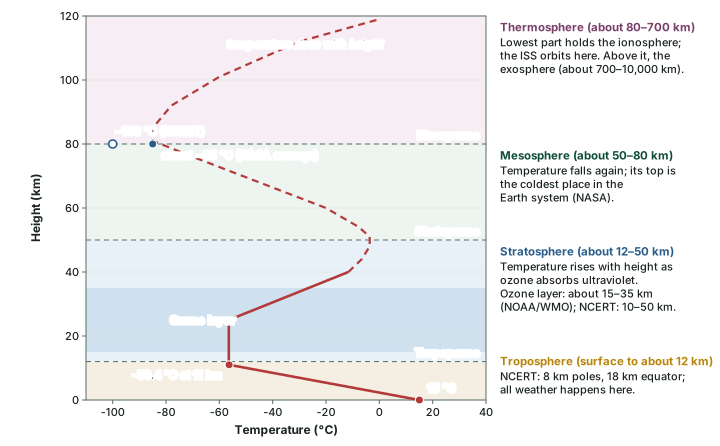
The atmosphere has no lid; it simply thins out with height. NCERT: "Density is highest near the surface of the earth and decreases with increasing altitude." To give it a structure, scientists divide it by how temperature changes with height. Where temperature falls with height we are in one layer; where the trend reverses we cross a boundary, called a pause, into the next. NCERT names five layers: "troposphere, stratosphere, mesosphere, thermosphere and exosphere". NASA uses the same five.
Troposphere
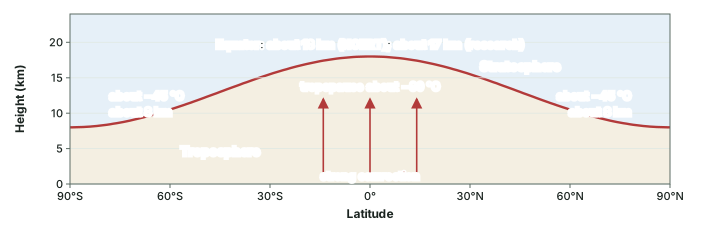
The troposphere is the lowest layer, and the one we live in. NCERT gives its average height as 13 km: "roughly to a height of 8 km near the poles and about 18 km at the equator". NASA rounds the average to about 12 km. Peer-reviewed work on the tropopause puts it at about 8 km near the poles and about 17 km near the equator (Atmospheric Chemistry and Physics, 2024). Learn NCERT's 8, 13 and 18 km for the examination, and know that research measurements put the equatorial figure a little lower.
The troposphere holds nearly all the water vapour and dust, so "all changes in climate and weather take place in this layer" (NCERT). Temperature falls with height here, because the air is heated from below by the ground, not from above by the Sun (see the insolation and heat budget part). The average rate of fall, the normal lapse rate, is 6.5 °C per 1,000 m (NCERT, ch 8); the temperature part takes it further.
Exam tip: One lapse rate, two NCERT numbers
NCERT gives the fall of temperature with height in two forms. Its ch 7 says "1°C for every 165m"; its ch 8 says 6.5 °C per 1,000 m, which works out to 1 °C for every 154 m (computed). The two do not match. The 6.5 °C per km figure matches the standard-atmosphere value NASA uses (6.49 °C per km, from T = 15.04 − 0.00649h); know that the 165 m line exists.
Why is the troposphere deepest at the equator? NCERT: "Thickness of the troposphere is greatest at the equator because heat is transported to great heights by strong convectional currents." Over the hot equatorial surface, rising air carries heat high up and lifts the top of the layer.
The tropopause is the boundary at the top of the troposphere. NCERT: "The air temperature at the tropopause is about minus 80°C over the equator and about minus 45°C over the poles. The temperature here is nearly constant, and hence, it is called the tropopause." It looks like a paradox, since the equator is the warmest place at the surface. The answer is height: over the equator the air goes on cooling with height for more than twice the distance (18 km against 8 km, NCERT) before it reaches the tropopause, so it ends up colder.
Why it happens
Over the equator, intense heating drives strong convection, which carries heat and moisture high into the sky and pushes the tropopause up. The higher the tropopause, the longer the air keeps cooling before it gets there, so the equatorial tropopause is both the highest and the coldest.
Stratosphere
Above the tropopause lies the stratosphere, extending "up to a height of 50 km" (NCERT); NASA gives about 12 to 50 km. Its defining feature is the ozone layer, which "absorbs ultra-violet radiation and shields life on the earth from intense, harmful form of energy" (NCERT). That absorbed energy warms the air, so in the stratosphere temperature rises with height (NASA). Its top is the stratopause.
Mesosphere
The mesosphere extends up to about 80 km (NCERT; NASA gives about 50 to 80 km). With little ozone to absorb sunlight, temperature again falls with height. NCERT says it "reaches up to minus 100°C at the height of 80 km". NASA describes the top of the mesosphere as "the coldest place found within the Earth system, with an average temperature of about minus 85 degrees Celsius". The two figures differ because one is a typical low value and the other an average: quote NCERT's −100 °C in the examination and know NASA's average. The upper limit is the mesopause.
Thermosphere and the ionosphere
Above the mesopause, NASA places the thermosphere at about 80 to 700 km, "whose lowest part contains the ionosphere. In this layer, temperatures increase with altitude". The International Space Station orbits in the thermosphere (NASA).
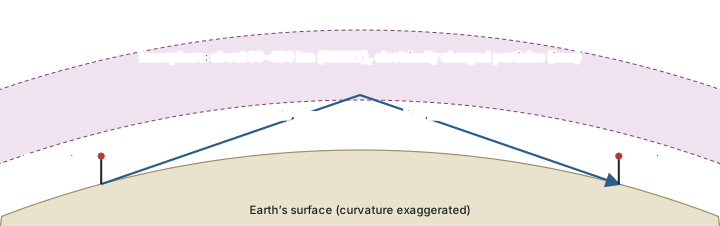
NCERT treats this region as the ionosphere: it is "located between 80 and 400 km above the mesopause. It contains electrically charged particles known as ions ... Radio waves transmitted from the earth are reflected back to the earth by this layer. Temperature here starts increasing with height." So a signal sent upward can come back down far from the transmitter (see the diagram below).
Exosphere
The exosphere is the outermost layer. NCERT says "very little is known about it" and that it gradually "merges with the outer space". NASA places it between about 700 and 10,000 km, where, at its top, it "merges with the solar wind".
Remember
NCERT: "geographers are concerned with the first two layers", the troposphere (weather) and the stratosphere (ozone). The ionosphere matters for radio. The International Space Station is in the thermosphere, not the exosphere (NASA).
The five layers compared
| Layer | Height: NCERT | Height: NASA | Temperature with height | Key features |
|---|---|---|---|---|
| Troposphere | 0 to 8 km (poles), 18 km (equator); average 13 km | 0 to about 12 km (average) | falls, 6.5 °C per km | all weather; nearly all water vapour and dust |
| Tropopause | top of the troposphere | - | nearly constant; about −80 °C (equator), −45 °C (poles) | boundary layer |
| Stratosphere | up to 50 km | about 12 to 50 km | rises | ozone layer absorbs ultraviolet |
| Mesosphere | up to 80 km | about 50 to 80 km | falls | top is the coldest place in the Earth system: −100 °C (NCERT), about −85 °C average (NASA) |
| Thermosphere / ionosphere | ionosphere 80 to 400 km | thermosphere about 80 to 700 km | rises | ions reflect radio waves; ISS orbits here |
| Exosphere | outermost; little known | about 700 to 10,000 km | - | merges with space and the solar wind |
Source: NCERT, Fundamentals of Physical Geography, Class XI, ch 7 "Composition and Structure of Atmosphere" (Reprint 2026-27); NASA, Earth's Atmosphere: A Multi-layered Cake (2019).
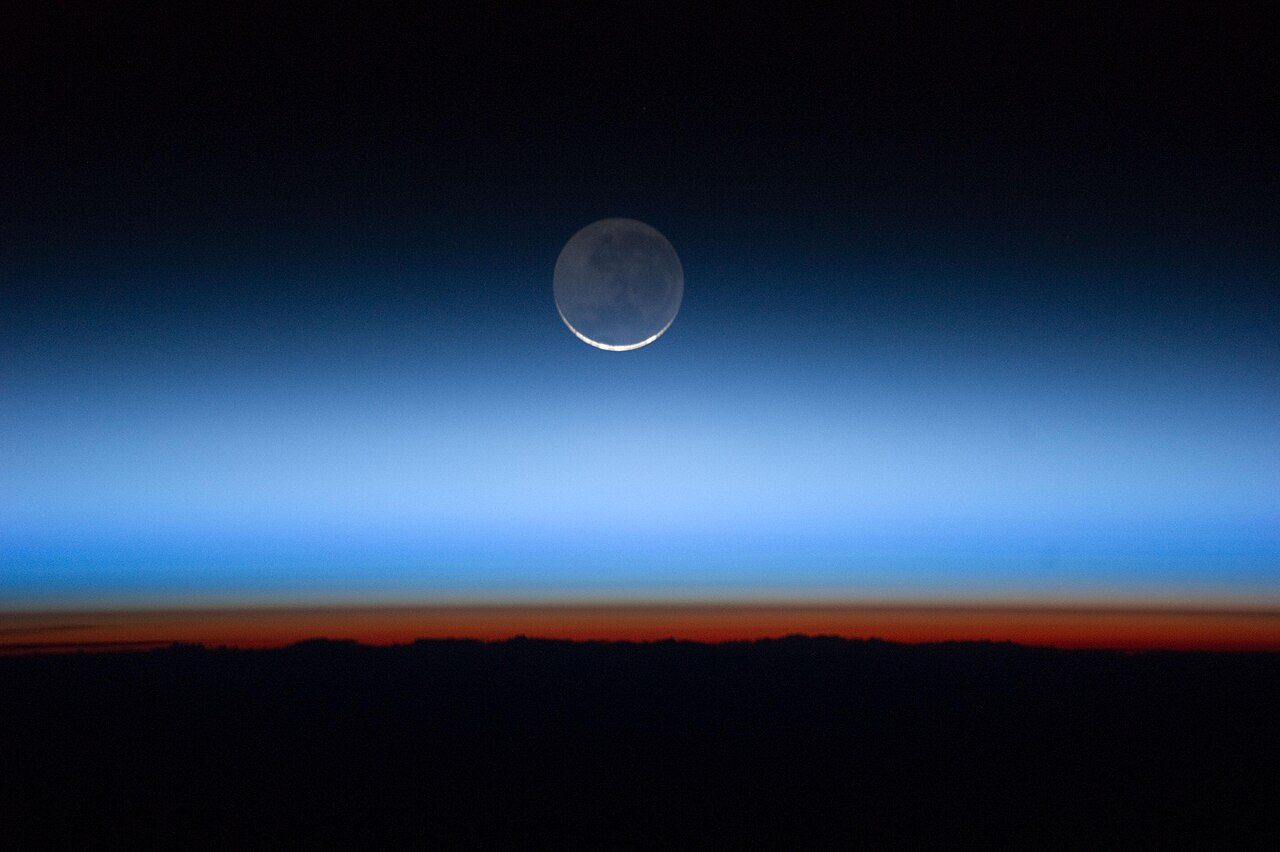
The photos below show three of the upper layers as they can be seen.
The ozone layer
Ozone (O3) is a molecule of three oxygen atoms. NCERT places it "between 10 and 50 km above the earth's surface", where it "acts as a filter and absorbs the ultra-violet rays radiating from the sun". The NOAA/WMO Twenty Questions (2022) narrows the ozone layer to the region of highest concentration, "between about 15 and 35 km altitude", and adds that about 90 per cent of all ozone is in the stratosphere and about 10 per cent in the troposphere. Both statements are right: NCERT gives the whole zone where ozone is found, NOAA/WMO the band where it is most concentrated.
How ozone forms
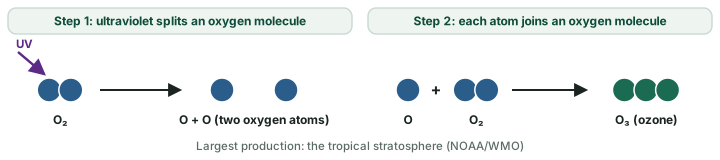
Ozone is made by sunlight in two steps (see the diagram below). "In the first step, solar ultraviolet radiation breaks apart one oxygen molecule (O2) to produce two oxygen atoms (2 O)." "In the second step, each of these highly reactive oxygen atoms combines with an oxygen molecule to produce an ozone molecule (O3)" (NOAA/WMO). The tropics receive the most sunlight, so "the largest ozone production occurs in the tropical stratosphere". Yet the total amount of ozone overhead is usually largest at high latitudes and lowest in the tropics. The reason is transport: stratospheric air carries ozone "from its source region in the tropics toward high latitudes", and "Ozone accumulates at middle and high latitudes" (NOAA/WMO Twenty Questions).
What ozone filters out
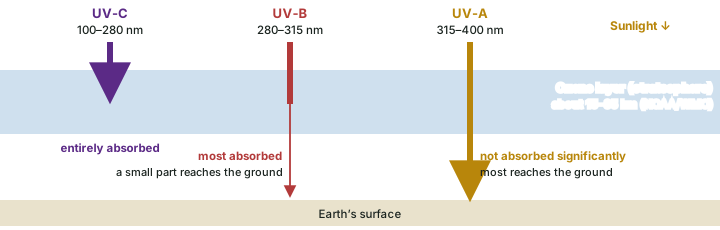
Ultraviolet (UV) light is divided by wavelength into three bands, and the ozone layer treats each differently (NOAA/WMO): UV-C (100 to 280 nanometres) is entirely absorbed; UV-B (280 to 315 nm) is mostly absorbed; UV-A (315 to 400 nm) is not absorbed significantly. Thinner ozone lets more UV-B reach the ground, and NOAA/WMO note that "Avoiding ozone depletion that would increase human exposure to UV-B radiation is a principal objective of the Montreal Protocol."
Don't confuse
"Good" and "bad" ozone. Stratospheric ozone is "good" ozone (NOAA/WMO): it shields life from UV. Ozone near the ground, in excess of natural amounts, is "bad" ozone, "harmful to humans, plants, and animals"; it forms mainly by reactions of hydrocarbon and nitrogen-oxide gases in sunlight (NOAA/WMO). Same molecule, different place.
Measuring ozone: the Dobson unit
The amount of ozone overhead is reported in Dobson units (DU). If all the ozone in the atmosphere were brought down to the surface and spread over the whole globe, the layer "would have an average thickness of about three millimeters", "which scientists would report as 300 Dobson Units" (NOAA/WMO). A column at one place and time can hold much more or much less than this average. So 1 DU is a layer 0.01 mm thick (computed: 3 mm ÷ 300). NASA counts the area where ozone falls below 220 DU as the ozone hole.
Ozone depletion and the Antarctic ozone hole
The culprits: ozone-depleting substances
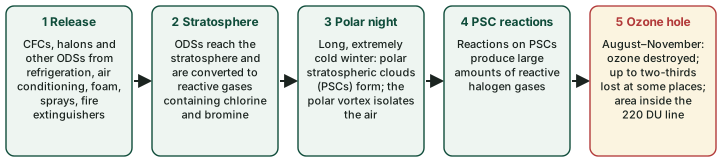
The damage was done by man-made gases called ozone-depleting substances (ODSs). The best known are the chlorofluorocarbons (CFCs), "containing only chlorine, fluorine, and carbon" (NOAA/WMO Twenty Questions). They were used in "refrigeration, air conditioning, foam blowing, spray can propellants, and cleaning of metals and electronic components". Halons, which contain bromine, were "used as fire extinguishing agents". Their stand-ins, the HCFCs, "are less harmful to the ozone layer compared to CFCs" and hydrofluorocarbons (HFCs) and hydrofluoroolefins (HFOs) "constitute the replacement for many applications of HCFCs".
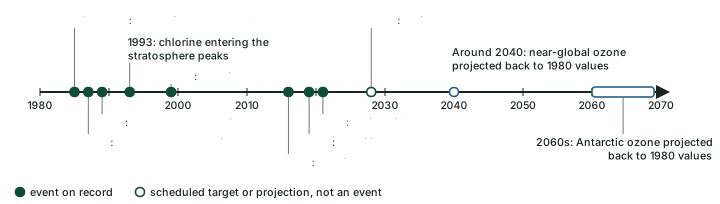
These gases are stable in the lower air, so they last long enough to reach the stratosphere. There they "are converted to reactive and reservoir gases containing chlorine and bromine that lead to ozone depletion". Because of the controls described below (the Montreal Protocol and the Kigali Amendment), "Total chlorine and total bromine entering the stratosphere peaked in 1993 and 1999, respectively", and have been falling since.
Why the hole forms over Antarctica
The Antarctic ozone hole was "first reported in the mid-1980s" (NOAA/WMO). It is "seasonal, occurring primarily in late winter and early spring (August-November)", and "Peak depletion occurs in early October", reducing total ozone "by as much as two-thirds at some locations". NOAA/WMO name three conditions that together make Antarctica special:
- "the long periods of extremely low temperatures during polar night, which cause polar stratospheric clouds (PSCs) to form";
- "the large abundance of reactive halogen gases produced in reactions on PSCs"; and
- "the isolation of polar stratospheric air". The boundary of the polar vortex, a belt of strong winds around the pole, does the isolating (see the general circulation and jet streams part).
In the early 1970s, Antarctic spring ozone was about 350 DU; in a deep modern hole the minimum is close to 150 DU (NOAA/WMO). "In late spring or early summer (November-December), these atmospheric winds weaken and the ozone hole disappears", until the next winter.
Why it happens
Why not over the Arctic as badly? The three conditions are strongest in the south. The Antarctic polar night is long and extremely cold, so polar stratospheric clouds form widely, and the vortex holds the air in isolation. The 2026 Assessment no longer gives an Arctic recovery date because, it says, "the concept of the date of return to 1980 levels is not appropriate for this region".
The yearly record
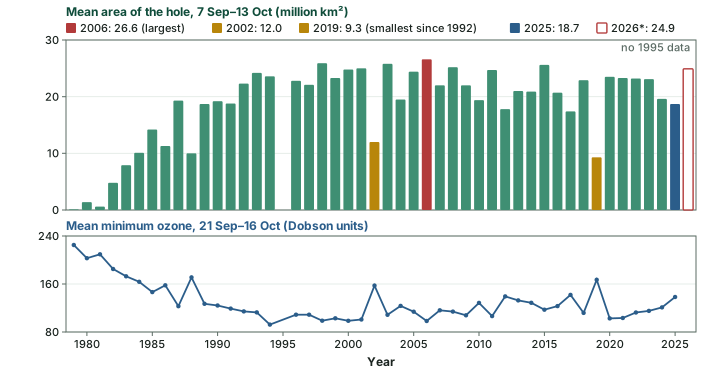
NASA's Ozone Watch records the hole every spring (see the chart below). Its mean area over 7 September to 13 October grew quickly through the 1980s and 1990s. The largest season mean in the series is 26.6 million km² in 2006, and the smallest since 1992 is 9.3 million km² in 2019. The size in any one year also depends on the polar vortex: NASA and NOAA tied the large 2026 hole to "an unusually powerful polar vortex".
The 2025 and 2026 seasons (NASA)
2025: the hole reached its largest one-day area, 22.86 million km², on 9 September 2025, and its season mean was the fifth smallest since 1992 (NASA, 25 November 2025). 2026: NASA reported on 4 November 2026 that the hole reached its "greatest one-day extent for the year on Sept. 18 at 10.5 million square miles (27.1 million square kilometers)", and that it "ranked seventh largest by area in 48 years of monitoring, but was not as deep as other large holes". NASA and NOAA said the ozone layer "remains on track for long-term recovery, despite atmospheric conditions that contributed to a larger Antarctic ozone hole in 2026".
The Montreal Protocol and the Kigali Amendment
The Montreal Protocol on Substances that Deplete the Ozone Layer was signed in 1987 and entered into force in 1989 (UNEP Ozone Secretariat). It phases out the production and use of the ODSs. The Parties have strengthened it as the science improved, "adjusting or amending the Protocol, which has been done six times since its creation" (UNEP). The most recent amendment is the Kigali Amendment.
The Kigali Amendment deals with the replacements. HFCs were brought in to replace the ODSs, and "Although they do not deplete the ozone layer, they are known to be powerful greenhouse gases" (UNEP). The Amendment was agreed at the 28th Meeting of the Parties in Kigali, Rwanda, on 15 October 2016, and entered into force on 1 January 2019. The UN Treaty Collection listed 176 parties as at 18 November 2026; UNEP's October 2026 briefing counted 175 of the 198 Parties to the Protocol (two counts on two dates).
India ratified the Kigali Amendment on 27 September 2021, and it entered into force for India on 26 December 2021 (UN depositary notification). India is in the group of countries whose HFC baseline is the average of 2024 to 2026, with a freeze in 2028 and cuts from there. In PIB's words, "India will complete its phase down of HFCs in 4 steps from 2032 onwards with cumulative reduction of 10% in 2032, 20% in 2037, 30% in 2042 and 85% in 2047." These are scheduled targets, not results.
Montreal Protocol and Kigali Amendment compared
| Montreal Protocol | Kigali Amendment | |
|---|---|---|
| Signed / adopted | 1987 | 15 October 2016 (28th Meeting of the Parties, Kigali) |
| In force | 1989 | 1 January 2019 (for India: 26 December 2021) |
| Gases controlled | ozone-depleting substances: CFCs, halons, HCFCs and others | HFCs, which do not deplete ozone but are powerful greenhouse gases |
| Aim | protect the ozone layer | phase down HFCs, so limiting warming |
| India | Party | ratified 27 September 2021; baseline 2024–26; freeze 2028; 85% cut by 2047 (scheduled) |
| Parties | every Party to the Protocol (198, UNEP) | 176 (UN Treaty Collection, 18 Nov 2026) |
Source: UNEP Ozone Secretariat, The Montreal Protocol; UN Treaty Collection, Kigali Amendment status; UN depositary notification C.N.282.2021; PIB, 18 August 2021.
Recovery: what the 2026 Assessment projects
The latest WMO/UNEP Scientific Assessment of Ozone Depletion: 2026 (Executive Summary, October 2026) projects, in a middle-of-the-road greenhouse-gas scenario, that "Antarctic TCO is projected to return to 1980 values during the 2060s" and that "Near-global-mean TCO is projected to return to 1980 values around 2040" (TCO is total column ozone). It sets no date for the Arctic. The previous (2022) Assessment had given about 2066 for the Antarctic, 2045 for the Arctic and 2040 for the rest of the world; those dates are now superseded. NASA's article of 4 November 2026 uses a different measure, the hole itself rather than total ozone: "scientists estimate that the ozone hole will recover by the 2070s". These are projections, not observations.
The treaty has helped the climate too. The Assessment says global compliance with the ODS phase-out "is expected to prevent warming of 0.25–0.89 °C by 2050", and that "Continued compliance with these Kigali Amendment provisions is estimated to prevent an additional 0.05–0.06 °C of warming by 2050 and up to 0.4 °C by 2100."
Don't confuse: Ozone hole vs global warming
The ozone hole is not global warming. The ozone hole is a thinning of stratospheric ozone caused by chlorine and bromine from ODSs; it lets in more UV-B. Global warming is a rise in surface temperature caused by greenhouse gases trapping heat (see the climate change part). They meet in two places: HFCs are powerful greenhouse gases (UNEP), and the 2026 Assessment credits the phase-out of ozone-depleting substances with preventing warming. Montreal (ozone) and Kigali (HFCs, under Montreal) are separate from Kyoto and Paris (climate treaties, covered in the climate change part).
Summary
- Dry air is 78.08% nitrogen, 20.95% oxygen and 0.934% argon (NASA); the rest are trace gases. Water vapour (up to 4%, NCERT) and dust are added to that.
- CO2 is a trace gas but a powerful greenhouse gas: 426.8 ppm in 2025 (WMO), 153% of pre-industrial, and the rise is accelerating.
- Five layers by temperature: troposphere (falls), stratosphere (rises), mesosphere (falls), thermosphere (rises), exosphere. The troposphere is about 8 km deep at the poles and 18 km at the equator (NCERT), and its top is colder over the equator.
- The ionosphere (80 to 400 km, NCERT) reflects radio waves.
- Ozone forms in two steps from O2 and UV; the ozone layer is about 15 to 35 km (NOAA/WMO; NCERT 10 to 50 km); 300 DU is a 3 mm layer.
- CFCs and halons, polar stratospheric clouds and the polar vortex make the Antarctic ozone hole each spring. The Montreal Protocol (1987) is repairing it; Antarctic ozone is projected to return to 1980 values during the 2060s (2026 Assessment). The Kigali Amendment (2016, in force 2019) phases down HFCs, which spare ozone but warm the climate.
Sources
Each table and data figure names its source beneath it. The main documents are collected here, with a date where the source carries one. Figures not listed under image credits were drawn for this page from the sources stated in their source lines.
Main sources
| Topic | Source |
|---|---|
| Textbook | NCERT, Fundamentals of Physical Geography, Class XI, ch 7 "Composition and Structure of Atmosphere" (Reprint 2026-27) |
| Gases of dry air | NASA Earth Fact Sheet |
| Greenhouse gases, 2025 global means | WMO Greenhouse Gas Bulletin No. 22 (27 October 2026) |
| The Keeling curve | NOAA GML, Mauna Loa monthly means (file of 9 October 2026, last month September 2026); NOAA GML, Mauna Loa annual means (1959 to 2025); NOAA GML, global marine-surface annual means |
| Layers of the atmosphere | NASA, Earth's Atmosphere: A Multi-layered Cake (2019, updated 22 October 2024); NASA Glenn Research Center, Earth Atmosphere Model |
| Tropopause height | Atmospheric Chemistry and Physics 24, 13653 (2024) |
| Ozone layer and ozone depletion | NOAA/WMO, Twenty Questions and Answers About the Ozone Layer (2022): Q1, Q6, Q10 |
| The ozone hole record | NASA Ozone Watch, annual records table (1979 to 2025); NASA, 25 November 2025 (2025 season); NASA and NOAA, 4 November 2026 (2026 season) |
| Montreal Protocol and Kigali Amendment | UNEP Ozone Secretariat, The Montreal Protocol; UN Treaty Collection, Kigali Amendment status; UN depositary notification C.N.282.2021; PIB, 18 August 2021 |
| Ozone recovery projections | Scientific Assessment of Ozone Depletion: 2026, Executive Summary (October 2026) |
Image credits
| Image | Credit and licence |
|---|---|
| Earth's limb seen from orbit ("Hovering on the Horizon", 31 July 2011) | NASA's Earth Observatory. CC BY 2.0, via Wikimedia Commons. File page |
| Noctilucent clouds over Laboe, Germany, 21 June 2019 | Matthias Süßen. CC BY-SA 4.0, via Wikimedia Commons. File page |
| The aurora australis seen from the International Space Station (2010) | ISS Expedition 23 crew. Public domain, via Wikimedia Commons. File page |
| All other figures | Drawn for this page from the sources given in their source lines. |