 BharatNotes
Part 2 of 11 of the Atmosphere and Climatology notes. The overview page has the quick revision and exam strategy for all eleven parts.
Insolation and the Heat Budget
Almost all the energy that drives winds, clouds and rain comes from the Sun. This part follows that energy: how much arrives, why some places and seasons get far more than others, how the air is heated from below rather than from above, and how the Earth sends the same amount back to space. It ends with the small imbalance that is now warming the planet.
Cross-paper relevance
- GS1 (Geography, primary): insolation and the factors that vary it, the heating of the atmosphere, the heat budget and the poleward transfer of heat
- GS3 (Environment): the enhanced greenhouse effect, the surface-albedo feedback behind the faster warming of the Arctic, and the Earth's energy imbalance
Solar radiation and the solar constant
The Sun is a very hot body and sends out most of its energy as short-wave radiation: visible light, with some ultraviolet and near-infrared. NCERT defines the part that reaches us: "The energy received by the earth is known as incoming solar radiation which in short is termed as insolation." The word is short for incoming solar radiation.
How much arrives? Above the atmosphere, a surface held square to the Sun's rays at the Earth's mean distance receives about 1,361 W/m², the solar constant (NASA Earth Fact Sheet, "Solar irradiance"). NCERT gives the older unit: on average "1.94 calories per sq. cm per minute at the top of its atmosphere", which converts to about 1,353 W/m² (computed below). The two agree within about 1%.
The Earth intercepts sunlight with its disc but spreads it over its whole sphere, and a sphere has four times the area of a disc of the same radius (4πR² against πR²). So, averaged over day and night and over the whole globe, the top of the atmosphere receives a quarter of the solar constant: 1,361 ÷ 4 ≈ 340 W/m² (computed). NASA Earth Observatory gives the same "approximately 340 watts per square meter". This 340 is the starting figure for the research heat budget described below.
Worked example: Converting NCERT's solar constant
NCERT gives 1.94 calories per square centimetre per minute. Express it in watts per square metre.
- 1 calorie = 4.184 joules, so 1.94 cal = 1.94 × 4.184 = 8.117 J.
- 1 m² = 10,000 cm², so per square metre: 8.117 × 10,000 = 81,170 J per minute.
- A watt is a joule per second: 81,170 ÷ 60 = 1,353 W/m².
Answer: about 1,353 W/m², close to NASA's 1,361 W/m².
Why does the Sun send short waves and the Earth long ones? NCERT states Planck's law: the "hotter a body, the more energy it will radiate and shorter the wavelength of that radiation." The Sun is far hotter than the Earth, so its radiation is intense and short-wave; the Earth, much cooler, radiates weakly and in long waves. This difference is the key to the greenhouse effect (see below).
Don't confuse
Insolation is short-wave radiation coming in from the Sun. Terrestrial radiation is long-wave radiation going out from the heated Earth. The atmosphere lets most of the first pass but absorbs much of the second, which is why it is heated from below.
Distance from the Sun
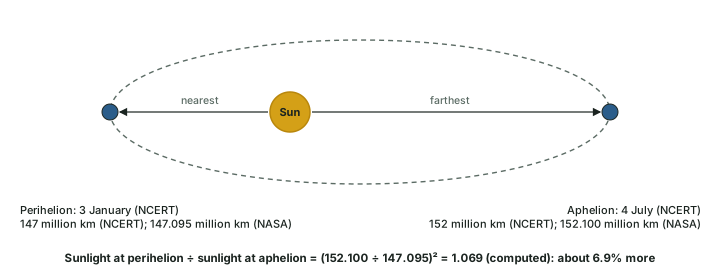
The Earth's orbit is slightly oval. NCERT: the Earth is farthest from the Sun (152 million km) on 4 July, the aphelion, and nearest (147 million km) on 3 January, the perihelion. NASA's figures are 152.100 and 147.095 million km. Radiation weakens with the square of distance, so the top of the atmosphere gets (152.100 ÷ 147.095)² = 1.069 times as much sunlight at perihelion: about 6.9% more (computed). Yet the Northern Hemisphere has its winter in January. NCERT explains that the effect of this variation "is masked by other factors like the distribution of land and sea and the atmospheric circulation", so it has no great effect on daily weather.
Exam tip
Perihelion falls in the Northern Hemisphere's winter. The seasons come from the tilt of the axis, not from the distance to the Sun.
What varies insolation
NCERT lists five factors that make insolation vary during a day, a season and a year: "(i) the rotation of earth on its axis; (ii) the angle of inclination of the sun's rays; (iii) the length of the day; (iv) the transparency of the atmosphere; (v) the configuration of land in terms of its aspect. The last two however, have less influence." Behind the first three lies one fact: the Earth's axis makes an angle of 66½° with the plane of its orbit, a tilt of 23½° from the upright, so the Sun's height and the length of daylight change through the year at every latitude.
The angle of the Sun's rays
This is the strongest control. NCERT: "The higher the latitude the less is the angle they make with the surface of the earth resulting in slant sun rays." A slanting beam does two kinds of damage to the energy it carries. First, it is spread over more ground, so each square metre gets less. Second, it passes through a thicker slice of the atmosphere, which means "more absorption, scattering and diffusion" (NCERT). The diagram below draws both for a Sun 30° above the horizon.
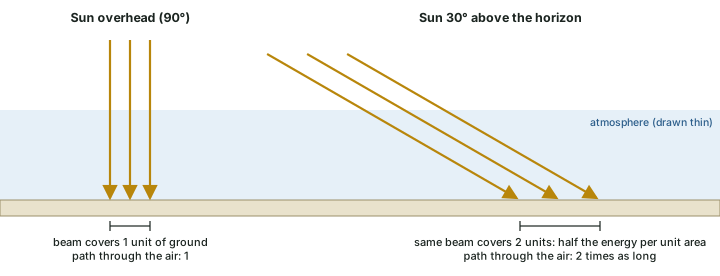
Sun's height, energy per unit area and path through the air
| Sun's elevation above the horizon | Energy per unit of ground (overhead Sun = 1) | Path length through the air (overhead = 1) |
|---|---|---|
| 90° | 1.00 | 1.00 |
| 60° | 0.87 | 1.15 |
| 45° | 0.71 | 1.41 |
| 30° | 0.50 | 2.00 |
| 20° | 0.34 | 2.92 |
| 10° | 0.17 | 5.76 |
Computed: energy = sin(elevation); path = 1 ÷ sin(elevation), flat-layer approximation (it overstates the path for a Sun very near the horizon).
The same geometry explains the daily cycle: the noon Sun is highest, so the strongest heating comes around midday, and the rotation of the Earth on its axis (NCERT's first factor) turns each place into and out of sunlight. It also explains aspect, NCERT's fifth factor: a slope that faces the Sun meets its rays more squarely than a slope that faces away, so it is warmer.
The length of the day
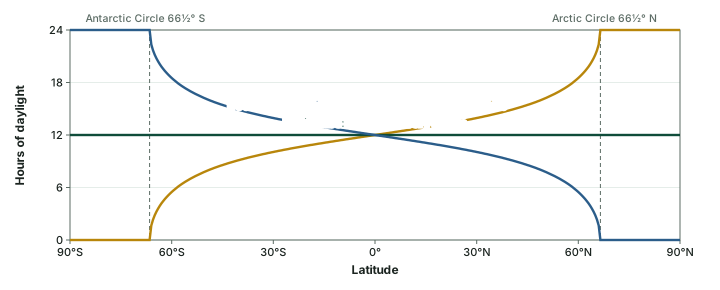
Because of the tilt, daylight is not 12 hours everywhere except at the equinoxes. At the June solstice the Sun is overhead at noon on 23.5° N (NCERT), the Northern Hemisphere has long days, and north of the Arctic Circle (66½° N) the Sun does not set. The Southern Hemisphere has the mirror image at the December solstice. The chart below computes daylight hours for every latitude. Long summer days partly make up for the low Sun at high latitudes.
The transparency of the atmosphere
NCERT notes that the atmosphere "is largely transparent to short wave solar radiation", but within the troposphere "water vapour, ozone and other gases absorb much of the near infrared radiation". Tiny suspended particles scatter visible light, which "adds colour to the sky": the blue of the sky and the red of the rising and setting Sun are both results of scattering (NCERT). Clouds, dust and haze cut the sunlight that reaches the ground; a clear, dry sky lets more through.
How insolation is distributed
Put the angle and the day length together and you get the insolation of each latitude through the year. The chart below computes it for the top of the atmosphere. Three results stand out. At the equator the year average is about 415 W/m², against about 174 W/m² at the poles (computed). At the equinoxes the equator gets the most. And at the June solstice the North Pole, with 24 hours of sunlight, receives more at the top of the atmosphere (543 W/m²) than the equator (397 W/m²) on that day (computed). Little of that polar sunshine warms the ground: the low Sun crosses a long path of air, and snow and ice reflect much of what arrives (see albedo, below).
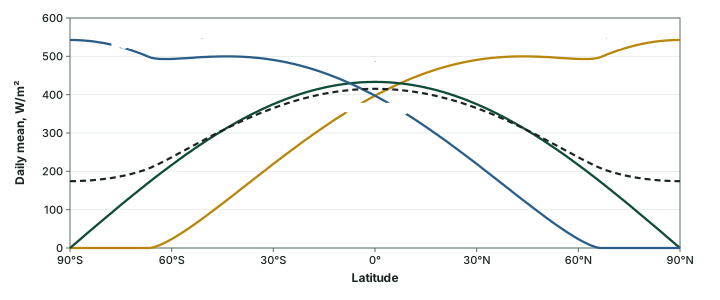
At the surface the pattern is reshaped by clouds. NCERT: insolation at the surface "varies from about 320 Watt/m² in the tropics to about 70 Watt/m² in the poles. Maximum insolation is received over the subtropical deserts, where the cloudiness is the least. Equator receives comparatively less insolation than the tropics." At the same latitude, continents receive more than oceans, and in winter the middle and higher latitudes receive less than in summer (NCERT).
Key idea
The top of the atmosphere is ruled by geometry (angle and day length). The surface is ruled by geometry and cloud. That is why the cloudy equator gets less sunshine at the ground than the clear subtropical deserts.
Albedo
Not all sunlight is absorbed. The share a surface reflects is its albedo, written as a fraction (0 to 1) or a percentage; NCERT's exercise pairs albedo with "The percentage of visible light reflected by an object". For the planet as a whole the albedo is about 0.30 (NASA Earth Observatory); the NASA Earth Fact Sheet gives a Bond albedo of 0.294. In NCERT's heat budget the 35 units reflected are "the albedo of the earth" (see the heat budget below).
Approximate albedo of common surfaces
| Surface | Albedo | Share of sunlight reflected |
|---|---|---|
| Fresh snow | 0.8–0.9 | 80–90% |
| Sea ice | 0.5–0.7 | 50–70% |
| Desert sand | 0.4 | 40% |
| Green grass | 0.25 | 25% |
| Bare soil | 0.17 | 17% |
| Conifer forest | 0.08–0.15 | 8–15% |
| Open ocean | 0.06 | 6% |
Source: Approximate values from the University of Colorado MOSAiC table; percentages are the same numbers written as percent.
The range is wide: fresh snow sends back most of the sunlight that falls on it, while the open ocean absorbs almost all of it. This is why melting sea ice matters. When bright ice gives way to dark water, the surface absorbs far more sunlight and warms further. IPCC AR6 (Working Group I, chapter 7) treats this surface-albedo feedback as one of several processes behind the faster warming of the Arctic; it is not the only cause.
Heating and cooling of the atmosphere
The Sun does not heat the air directly very much. It heats the ground, and the ground heats the air. NCERT describes four processes.
Conduction. When two bodies of unequal temperature touch, heat flows from the warmer to the cooler until both reach the same temperature or the contact is broken. Air touching warm ground is heated this way. NCERT: "Conduction is important in heating the lower layers of the atmosphere." Air is a poor conductor, so conduction alone warms only a thin layer.
Convection. Heated air rises in currents and carries heat upward; cooler air sinks to take its place. NCERT calls this "vertical heating of the atmosphere" and adds that "The convective transfer of energy is confined only to the troposphere."
Advection. Wind carries heat sideways. NCERT: "Horizontal movement of the air is relatively more important than the vertical movement." In middle latitudes most day-and-night changes in weather come from advection, and the loo, the hot summer wind of northern India, "is the outcome of advection process" (NCERT).
Terrestrial radiation. The heated Earth becomes a radiating body and sends energy upward in long waves. These are absorbed by the atmospheric gases, "particularly by carbon dioxide and the other green house gases", so "the atmosphere is indirectly heated by the earth's radiation" (NCERT). The atmosphere in turn radiates heat to space. This is why air temperature normally falls with height (see the temperature part): the heat source is at the bottom.
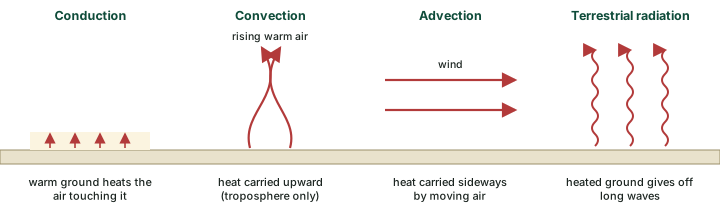
Conduction, convection, advection and radiation compared
| Process | How heat moves | Direction | Where it matters |
|---|---|---|---|
| Conduction | by contact, from warmer to cooler | ground to the air touching it | heats the lowest layer of air |
| Convection | heated air rises in currents | vertical | only within the troposphere |
| Advection | moving air carries heat | horizontal | day-to-night weather changes in middle latitudes; the loo |
| Terrestrial radiation | long waves given off by the heated Earth | upward from the surface | heats the atmosphere from below |
Source: NCERT, Fundamentals of Physical Geography, Class XI, ch 8 "Solar Radiation, Heat Balance and Temperature" (Reprint 2026-27)
Exam tip
NCERT's exam point: the atmosphere is heated mainly by long-wave terrestrial radiation, not by short-wave sunlight passing through it.
The greenhouse effect
The atmosphere treats the two kinds of radiation differently. NCERT (ch 7) says carbon dioxide is "transparent to the incoming solar radiation but opaque to the outgoing terrestrial radiation". Water vapour, CO2, methane and other greenhouse gases absorb much of the Earth's long-wave radiation and send part of it back down. The surface is therefore warmed twice: by the Sun and by this back-radiation from the air.
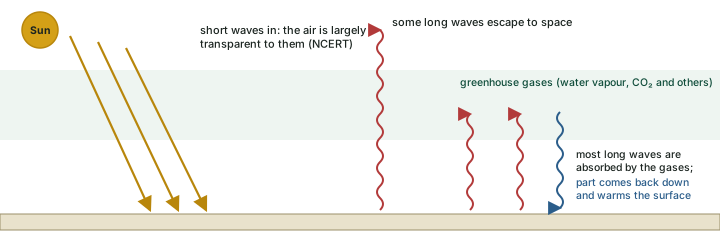
How big is the effect? The NASA Earth Fact Sheet gives the Earth's average temperature as 288 K (15 °C) and its black-body temperature, the temperature it would have with no greenhouse effect, as 254 K. The difference, 288 − 254 = 34 degrees (computed), is the natural greenhouse effect; NASA Earth Observatory describes it as warming the surface by more than 30 degrees. Without it the Earth's average would be well below freezing.
- 1,361 W/m² solar constant (NASA)
- ≈ 340 W/m² average at the top of the atmosphere (1,361 ÷ 4)
- 288 K mean surface temperature (NASA)
- 254 K black-body temperature (NASA)
Don't confuse
The natural greenhouse effect keeps the Earth habitable and has always existed. The enhanced greenhouse effect is the extra warming from the greenhouse gases humans add, such as the rising carbon dioxide described in the composition and structure part; it is the subject of the climate change part. The ozone hole is a separate problem (see the composition and structure part).
The heat budget
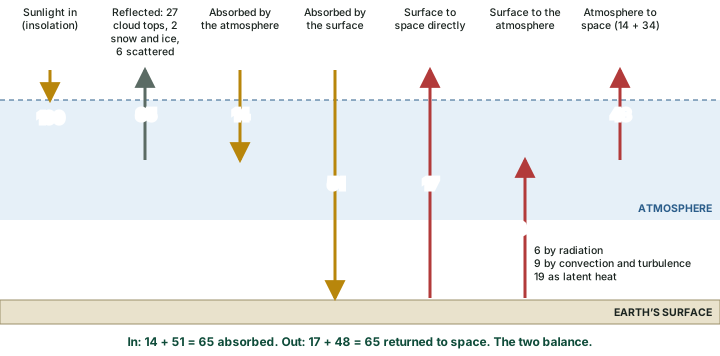
Over a long period the Earth "does not accumulate or loose [sic] heat" (NCERT). That can only happen if the energy it receives as insolation equals the energy it loses as terrestrial radiation. The account of income and spending is the heat budget. NCERT draws it with the insolation at the top of the atmosphere taken as 100 units.
Income. Roughly 35 units are reflected back to space before they can be used: 27 from the tops of clouds, 2 from snow and ice, and 6 scattered back by the atmosphere. "The reflected amount of radiation is called the albedo of the earth" (NCERT). The remaining 65 units are absorbed: 14 within the atmosphere and 51 by the surface.
Spending. The surface gives back its 51 units. Of these, 17 go straight to space and 34 are absorbed by the atmosphere: 6 by direct absorption of radiation, 9 through convection and turbulence, and 19 through the latent heat of condensation (heat taken up when water evaporates at the surface and released when it condenses in clouds; see the water in the atmosphere part). The atmosphere now holds 14 + 34 = 48 units, and it radiates these to space. Total sent back: 17 + 48 = 65, which balances the 65 absorbed (NCERT).
Research budgets use watts per square metre and measured flows. NASA Earth Observatory starts from the 340 W/m² average: about 29% is reflected, 23% is absorbed by the atmosphere and 48% by the surface. On the way out, "The atmosphere radiates heat equivalent to 59 percent of incoming sunlight; the surface radiates only 12 percent." Inside the system the flows are much larger than the net figures: the heat flowing up from the surface equals 117% of incoming sunlight, and the back-radiation from the atmosphere to the ground equals 100% (NASA Earth Observatory).
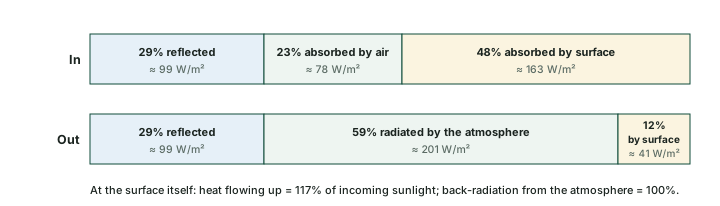
Two versions of the heat budget
| Flow | NCERT (units of 100) | NASA Earth Observatory (% of incoming) |
|---|---|---|
| Reflected to space (albedo) | 35 (27 clouds, 2 snow and ice, 6 scattered) | 29% |
| Absorbed by the atmosphere | 14 | 23% |
| Absorbed by the surface | 51 | 48% |
| Radiated to space by the surface | 17 | 12% |
| Radiated to space by the atmosphere | 48 | 59% |
| Check: out = in | 17 + 48 = 65 = 14 + 51 | 12 + 59 = 71 = 23 + 48 |
Source: NCERT, Fundamentals of Physical Geography, Class XI, ch 8 "Solar Radiation, Heat Balance and Temperature" (Reprint 2026-27); NASA Earth Observatory. Check rows computed.
The two do not match line by line, because they are different estimates on different bases. In NCERT's diagram the surface simply returns the 51 units it absorbs; the research budget also shows the large two-way exchange between the surface and the air (117% up, 100% back). Learn NCERT's numbers for the exam and the research figures for the current picture.
Exam tip
Check any heat-budget question with the totals: in NCERT, 35 reflected + 65 absorbed = 100, and 17 + 48 = 65. If a figure in an option breaks these sums, it is wrong.
Surplus, deficit and the poleward transfer of heat
The budget balances for the planet as a whole, but not for each latitude. NCERT (Figure 8.3) shows a surplus of net radiation between 40° N and 40° S and a deficit towards the poles. Low latitudes take in more energy than they radiate away; high latitudes radiate more than they take in. If nothing moved the heat, the tropics would get hotter year after year and the high latitudes would freeze. Instead, "The surplus heat energy from the tropics is redistributed pole wards" (NCERT).
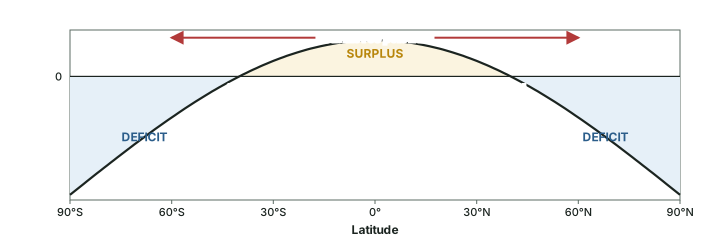
This transfer is the engine of the general circulation. Unequal heating makes unequal pressure, and NCERT notes that "This leads to transfer of heat from one region to the other by winds." The pressure and winds part explains pressure and the forces on the wind; the general circulation part shows how the great wind belts carry the tropical surplus poleward.
The Earth's energy imbalance
NCERT's budget is a long-run balance. Today the balance is slightly off: the Earth absorbs a little more energy than it radiates, and the difference, the Earth's energy imbalance, is stored as heat. A study of the global heat inventory (von Schuckmann and others, Earth System Science Data, 2023) found 381 ± 61 zettajoules accumulated from 1971 to 2020, a heating rate of 0.48 ± 0.1 W/m², rising to 0.76 ± 0.2 W/m² over 2006–2020. Set against the 340 W/m² average input, 0.76 W/m² is about 0.22% (computed): small as a share, very large as total energy.
WMO's State of the Global Climate 2025 (23 March 2026) says the imbalance "has increased since its observational record began in 1960, particularly in the past 20 years. It reached a new high in 2025." Almost all of the extra heat goes into the ocean (WMO).
Where the extra heat goes
| Store | von Schuckmann et al. (ESSD 2023), 1971–2020 | WMO State of the Global Climate 2025 |
|---|---|---|
| Ocean | about 89% | more than 91% |
| Land | about 6% | about 5% |
| Ice (cryosphere) | about 4% | about 3% (melting ice) |
| Atmosphere | about 1% | about 1% |
Source: von Schuckmann et al. 2023, Earth System Science Data 15; WMO, 23 March 2026.
Remember
Only about 1% of the extra energy warms the air. The rise in air temperature that makes the news is the small visible part of a much larger store of heat in the ocean.
Summary
- Insolation is incoming short-wave solar radiation. The solar constant is about 1,361 W/m² (NASA); NCERT gives 1.94 cal/cm²/min. Averaged over the globe the top of the atmosphere gets about 340 W/m².
- Perihelion (3 January, 147 million km) and aphelion (4 July, 152 million km) change sunlight by about 7% (computed), but land, sea and circulation mask the effect.
- The angle of the rays, the length of day, the rotation of the Earth, the transparency of the air and aspect vary insolation; the last two matter least (NCERT).
- At the surface, insolation runs from about 320 W/m² in the tropics to 70 W/m² at the poles, and is highest over the cloud-free subtropical deserts (NCERT).
- The air is heated from below: conduction, convection, advection and, above all, terrestrial long-wave radiation absorbed by greenhouse gases.
- NCERT's budget: 35 reflected, 14 absorbed by air, 51 by the surface; 17 + 48 = 65 returned. NASA: 29% reflected, 23% and 48% absorbed.
- There is a surplus between 40° N and S and a deficit towards the poles; winds carry heat poleward. The Earth's energy imbalance reached a new high in 2025 (WMO).
Sources
Each table and data figure names its source beneath it. The main documents are collected here, with a date where the source carries one. Figures not listed under image credits were drawn for this page from the sources stated in their source lines.
Main sources
| Topic | Source |
|---|---|
| Textbook | NCERT, Fundamentals of Physical Geography, Class XI, ch 8 "Solar Radiation, Heat Balance and Temperature" and ch 7 "Composition and Structure of Atmosphere" (Reprint 2026-27) |
| Solar constant, Earth–Sun distance, planetary albedo, surface and black-body temperatures | NASA Earth Fact Sheet |
| Research energy budget | NASA Earth Observatory, Climate and Earth’s Energy Budget |
| Albedo of surfaces | University of Colorado MOSAiC table |
| Surface-albedo feedback and Arctic warming | IPCC AR6, Working Group I, chapter 7 |
| Global heat inventory, 1971 to 2020 | von Schuckmann et al. 2023, Earth System Science Data 15 |
| Earth's energy imbalance, 2025 | WMO, State of the Global Climate 2025, 23 March 2026 |
Image credits
| Image | Credit and licence |
|---|---|
| All other figures | Drawn for this page from the sources given in their source lines. |