 BharatNotes
Part 10 of 11 of the Atmosphere and Climatology notes. The overview page has the quick revision and exam strategy for all eleven parts.
World Climates: Köppen's Classification
Every place has weather, but only a long record of that weather tells us its climate. Wladimir Köppen turned such records into a set of letters, so that one short code (Af, BWh, Cfb) sums up a place's warmth, its rain and the season the rain comes in. This part explains how the code works, the version NCERT teaches and the version researchers map today.
Weather, climate and the ways to classify climate
The two words are often mixed up, so begin with definitions from the US National Weather Service (NOAA) glossary. Weather is "The state of the atmosphere with respect to wind, temperature, cloudiness, moisture, pressure, etc." (NWS glossary: weather) Climate is "The composite or generally prevailing weather conditions of a region, throughout the year, averaged over a series of years." (NWS glossary: climate) Weather is what a day brings; climate is the pattern that many years of days add up to. A single cold week in Delhi (India) says nothing about its climate; the monthly means of many years do.
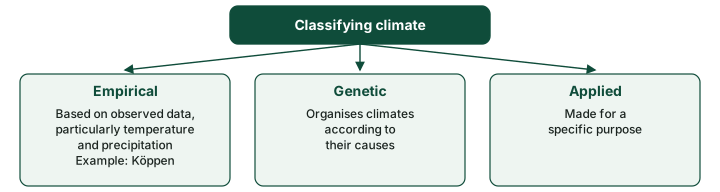
Climates vary from place to place, and to compare them we must sort them into classes. NCERT names three broad approaches. Empirical classification is based on observed data, particularly on temperature and precipitation. Genetic classification organises climates according to their causes. Applied classification is made for a specific purpose. Köppen's scheme, the subject of this part, is empirical: it uses what thermometers and rain gauges record, not the winds or air masses that produce those readings (the general circulation and air masses and fronts parts explain those causes).
Don't confuse
Empirical vs genetic. An empirical class says what a climate is (for example, every month warmer than 18 °C). A genetic class says why it is so. Köppen is empirical, which is why its letters are defined by numbers.
Köppen's scheme: who and when
In the words of Kottek et al. (2006), World Map of the Köppen-Geiger climate classification updated, Meteorologische Zeitschrift 15, 259-263, Wladimir Köppen "was trained as a plant physiologist and realised that plants are indicators for many climatic elements", and his classification was built on "five vegetation groups". Beck et al. (2023) make the same point: "Drawing on his observation as a botanist that climatic conditions are a major driver of the global vegetation distribution, Köppen designed his classification to align with the major ecosystem types worldwide". NCERT puts it simply: Köppen saw a close relationship between vegetation and climate, chose values of temperature and precipitation that matched the limits of vegetation, and used capital and small letters to name the groups and types.
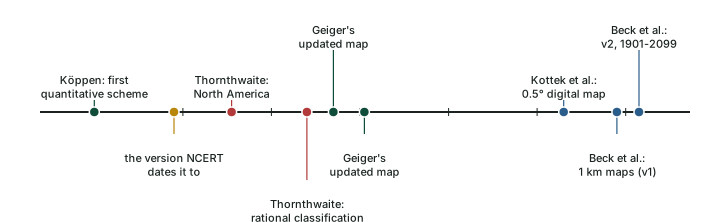
When was it made? NCERT says the scheme was "developed in 1918 and modified over a period of time". Kottek et al. (2006) date it earlier: "The first quantitative classification of world climates was presented by the German scientist Wladimir Köppen (1846–1940) in 1900; it has been available as world map updated 1954 and 1961 by Rudolf Geiger (1894–1981)." The two fit together: Köppen's first quantitative classification appeared in 1900 and was revised several times (1918 is the version NCERT dates it to); Rudolf Geiger later refined it, which is why it is now called the Köppen-Geiger classification. Its roots are older still: Beck et al. (2023), Scientific Data 10, 724 say it was "developed in the late 19th century" and cite, for that, Köppen's 1884 paper on the thermal zones of the Earth (Meteorologische Zeitschrift 1, 215–226). Kottek et al. call Köppen a German scientist; Beck et al. (2023), Scientific Data 10, 724 call him a "Russian-German climatologist". NCERT spells the name "Koeppen" (and gives his initial as V.); these notes use Köppen, the spelling of both research papers.
Exam tip
If a question gives 1918, it is following NCERT. Know both dates: 1900 for the first quantitative scheme, 1918 for the revision NCERT cites, and 1954 and 1961 for Geiger's updated maps.
The five groups
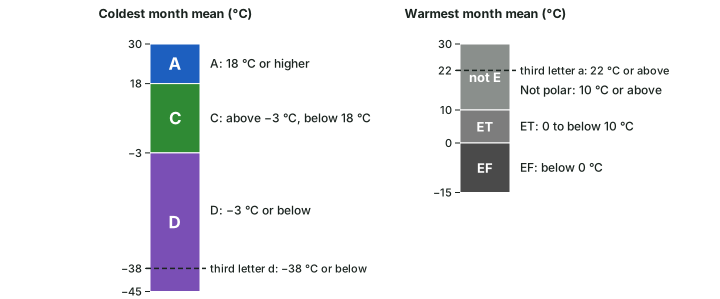
Köppen recognised five major climatic groups. Four are based on temperature and one on precipitation. The capital letters A, C, D and E mark humid climates, and B marks dry climates. NCERT's Table 11.1 gives the thresholds, set out in the table below beside the modern criteria of Kottek et al. (2006), where Tmin and Tmax are the mean temperatures of the coldest and warmest months.
Three temperature limits do most of the work. A coldest month of 18 °C or more makes a climate tropical (A). A coldest month between −3 °C and 18 °C makes it warm temperate (C), and −3 °C or below makes it a cold snow-forest climate (D). The fifth, E, is decided by the warmest month: if even the warmest month stays below 10 °C, the climate is polar. The diagram below puts these limits on one thermometer.
The five Köppen groups: NCERT and the modern criteria
| Group | NCERT name | NCERT criterion (its Table 11.1) | Modern criterion (Kottek et al. 2006) | Latitudes (NCERT) |
|---|---|---|---|---|
| A | Tropical (humid) | Average temperature of the coldest month 18 °C or higher | Tmin ≥ +18 °C | Between the Tropics of Cancer and Capricorn |
| B | Dry climates | Potential evaporation exceeds precipitation | Pann < 10 Pth (see the dryness limit below) | 15°-60° N and S |
| C | Warm temperate (mid-latitude) | Coldest month higher than −3 °C but below 18 °C | −3 °C < Tmin < +18 °C | 30°-50°, mainly on eastern and western margins |
| D | Cold snow-forest | Coldest month −3 °C or below | Tmin ≤ −3 °C | 40°-70° N, in Europe, Asia and North America |
| E | Cold (polar) | Average temperature of all months below 10 °C | Tmax < +10 °C | Poleward of 70° |
Source: NCERT, Fundamentals of Physical Geography, Class XI, ch 11 "World Climate and Climate Change" (Reprint 2026-27), Table 11.1 and text; Kottek et al. (2006), World Map of the Köppen-Geiger climate classification updated, Meteorologische Zeitschrift 15, 259-263, Table 1.
Which test comes first? A place can pass more than one test: a desert in the tropics has a coldest month above 18 °C, yet it is not group A. Kottek et al. settle the order: "This key implies that the polar climates (E) have to be determined first, followed by the arid climates (B) and subsequent differentiations into the equatorial climates (A) and the warm temperate and snow climates (C) and (D), respectively." So the Sahara is B, not A, because the dryness test comes before the temperature tests for A, C and D.
Remember
Test E first (warmest month below 10 °C), then B (too dry for its warmth), then A, C or D by the coldest month: 18 °C and −3 °C are the two lines.
The Highland group has gone. The 2020 NCERT edition listed a sixth group, "H - High Land Cold due to elevation", and said: "Highland climates are governed by topography. In high mountains, large changes in mean temperature occur over short distances. Precipitation types and intensity also vary spatially across high lands." (NCERT, Fundamentals of Physical Geography, Class XI, ch 12 "World Climate and Climate Change" (2020 edition).) The current reprint (2026-27) has removed H and keeps only the five groups above. The Köppen-Geiger maps of Kottek et al. and Beck et al. have no H either: a mountain is classed by its own temperature and rain, so high ground in the tropics can fall in C, D or even E.
The small letters and the dryness limit
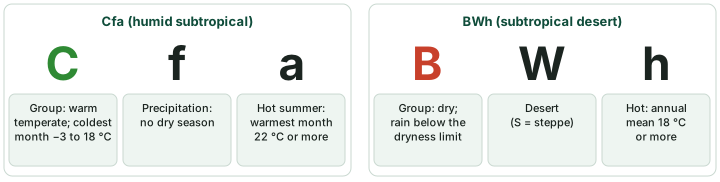
The groups are split into types by more letters. NCERT explains: the small letters f, m, w and s mark the seasons of dryness, "where f corresponds to no dry season, m - monsoon climate, w- winter dry season and s - summer dry season". The small letters a, b, c and d "refer to the degree of severity of temperature". Dry climates take a second capital: S for steppe or semi-arid and W for desert. A third letter, h or k, then marks a hot or a cold dry climate.
The letters and what they mean
| Letter | Meaning (Beck et al. 2023 legend) | Modern criterion (Kottek et al. 2006) | Examples |
|---|---|---|---|
| f | no dry season | Af: driest month ≥ 60 mm; Cf, Df: neither s nor w | Af, Cfb, Dfc |
| m | monsoon | Pann ≥ 25 (100 − Pmin) | Am |
| w | dry winter | Aw: driest month < 60 mm, in winter. Cw, Dw: Pwmin < Psmin and Psmax > 10 Pwmin | Aw, Cwa, Dwb |
| s | dry summer | Cs, Ds: Psmin < Pwmin, Pwmax > 3 Psmin and Psmin < 40 mm | Csa, Csb |
| W / S | desert / steppe | BW: Pann ≤ 5 Pth; BS: Pann > 5 Pth | BWh, BSk |
| h / k | hot / cold (dry climates) | Tann ≥ +18 °C / Tann < +18 °C | BWh, BSk |
| a | hot summer | Tmax ≥ +22 °C | Cfa, Dwa |
| b | warm summer | not (a), and at least four months with a mean of +10 °C or more | Cfb, Dfb |
| c | cold summer | not (b), and Tmin > −38 °C | Dfc |
| d | very cold winter | like (c), but Tmin ≤ −38 °C | Dfd |
| T / F | tundra / frost (ice cap) | ET: 0 °C ≤ Tmax < +10 °C; EF: Tmax < 0 °C | ET, EF |
Source: Beck et al. (2023), Scientific Data 10, 724, legend of the map files; Kottek et al. (2006), World Map of the Köppen-Geiger climate classification updated, Meteorologische Zeitschrift 15, 259-263, Tables 1 and 2. Pmin: precipitation of the driest month; s and w subscripts: summer and winter half-year; Pann, Tann: annual totals and means.
How dry is dry? NCERT defines group B as climates where potential evaporation exceeds precipitation. Rain that falls in a hot place evaporates faster, so a hot place needs more rain than a cool one to count as humid. Kottek et al. turn this into a dryness threshold, Pth in mm, that rises with the annual mean temperature Tann in °C: Pth = 2 Tann if at least two-thirds of the rain falls in winter, 2 Tann + 28 if at least two-thirds falls in summer, and 2 Tann + 14 otherwise. A climate is B if its annual rain is below 10 Pth, and desert (BW) if it is no more than 5 Pth. Summer rain raises the threshold because it falls when evaporation is highest.
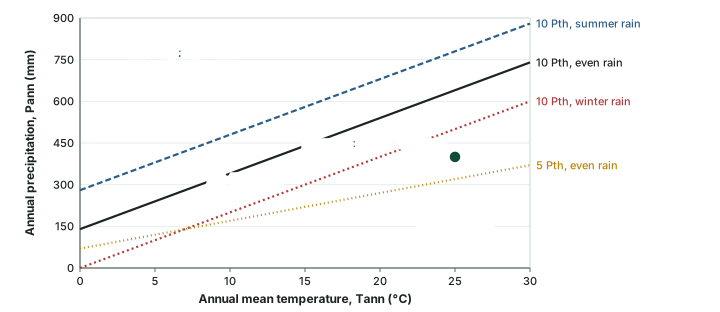
Worked example: Is a place dry, and is it desert or steppe?
A place has an annual mean temperature of 25 °C and 400 mm of rain a year, spread through the year. Its coldest month is above 18 °C. Classify it.
- Test E: the warmest month is far above 10 °C, so it is not polar.
- Dryness threshold for even rain: Pth = 2 × 25 + 14 = 64 mm.
- B limit: 10 Pth = 640 mm. 400 mm is below it, so the place is dry (B).
- Desert limit: 5 Pth = 320 mm. 400 mm is above it, so it is steppe (S), not desert.
- Tann = 25 °C is 18 °C or more, so the third letter is h.
- Check with summer rain: Pth = 2 × 25 + 28 = 78 mm; the limits become 780 and 390 mm, and 400 mm still lies between them.
Answer: BSh, a hot steppe. Note that it is B even though its coldest month passes the A test, because B is tested first.
The climate types, as NCERT describes them
NCERT's Table 11.2 lists fourteen types. Some of its codes are shorter than the standard Köppen-Geiger codes used on research maps: NCERT's Cs covers Csa, Csb and Csc; its Df and Dw carry no third letter; and the text names two humid subtropical types (Cwa and Cfa) while the table lists only Cfa. The table at the end of this section gives NCERT's account of each type, with the standard classes it covers.
Tropical humid climates (A)
Tropical humid climates lie between the Tropic of Cancer and the Tropic of Capricorn. NCERT gives two reasons for their heat and humidity: the Sun is high overhead through the year, and the Inter Tropical Convergence Zone (ITCZ) lies over them. The annual range of temperature is very low and the annual rainfall is high. Af (tropical wet) lies near the equator: the Amazon Basin in South America, western equatorial Africa and the islands of the East Indies. Rain falls in every month, as afternoon thundershowers (the water in the atmosphere part explains convectional rain). The maximum on any day is around 30 °C and the minimum around 20 °C, and the vegetation is tropical evergreen forest with a dense canopy and large biodiversity.
Am (tropical monsoon) covers the Indian sub-continent, the north-eastern part of South America and northern Australia: heavy rain falls mostly in summer and the winter is dry. The mechanism of the Indian monsoon is treated on the page Monsoon Mechanism, Jet Streams and Tropical Cyclones. Aw (tropical wet and dry) lies north and south of the Af regions: north and south of the Amazon forest in Brazil and adjoining Bolivia and Paraguay, and in Sudan and south of Central Africa. Its rain is less and more variable than in Af and Am, the dry season is longer, and the daily range of temperature is greatest in the dry season. NCERT gives deciduous forest and grassland with scattered trees as its vegetation.
Dry climates (B)
Dry climates cover a very large area, from 15° to 60° north and south of the equator. Between 15° and 30° they lie under the subtropical highs, where sinking air and temperature inversions stop rain from forming. Next to cold ocean currents they reach further towards the equator, as on the west coast of South America. Between 35° and 60° they lie in the interiors of continents and in areas often surrounded by mountains. NCERT places BSh and BWh at 15°-35° and BSk and BWk at 35°-60°; the modern criterion separates h from k by the annual mean temperature (18 °C), not by latitude, so the split on a modern map does not follow NCERT's latitude lines exactly.
Steppe receives slightly more rain than desert, enough for sparse grassland. In both, rainfall varies greatly from year to year, and the variation hits the steppe harder, often causing famine. Desert rain comes in short, intense thundershowers that do little to build soil moisture, and fog is common in coastal deserts beside cold currents. Summer maxima are very high, and the annual and daily ranges are large. NCERT adds that "The highest shade temperature of 58° C was recorded at Al Aziziyah, Libya on 13 September 1922". A WMO evaluation panel (2010-2012) rejected that reading; the temperature part gives the record WMO accepts today.
Why it happens
The world's great hot deserts sit near 15°-30° on the western sides of continents because two things combine there (NCERT): sinking air under the subtropical high warms as it descends and forms an inversion that stops rising air (see the temperature and water in the atmosphere parts), and cold currents offshore chill the air above them. Fog forms over the coast, but rain does not.
Warm temperate (mid-latitude) climates (C)
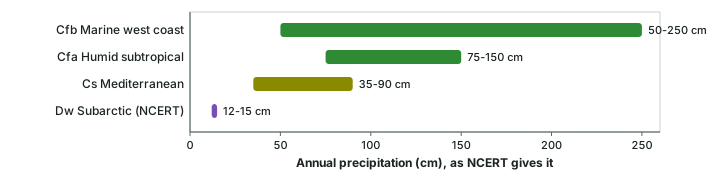
These extend from 30° to 50° of latitude, mainly on the eastern and western margins of continents, with warm summers and mild winters. NCERT gives four types. Cwa (humid subtropical, dry winter and hot summer) lies poleward of the tropics, mainly in the North Indian plains (India) and the interior plains of South China; NCERT calls it similar to Aw except that the winter is warm. Cs (Mediterranean) lies around the Mediterranean Sea and on west coasts between 30° and 40°: central California, central Chile and the coasts of south-eastern and south-western Australia. The subtropical high brings a hot, dry summer and the westerlies a mild, rainy winter (see the general circulation); summer months average around 25 °C, winter months below 10 °C, and the annual total is 35-90 cm.
Cfa (humid subtropical, no dry season) lies on the eastern sides of continents: the eastern United States, southern and eastern China, southern Japan, north-eastern Argentina, coastal south Africa and the eastern coast of Australia. Unstable air masses bring rain all year, as summer thunderstorms and winter frontal rain (see air masses and fronts); the annual total is 75-150 cm, summer months average around 27 °C, and winter months 5-12 °C. Cfb (marine west coast) lies poleward of the Mediterranean type on west coasts: north-western Europe, the west coast of North America north of California, southern Chile, south-eastern Australia and New Zealand. The sea keeps it mild, with winters warmer than the latitude suggests: summer months 15-20 °C, winter months 4-10 °C, and 50-250 cm of rain through the year.
Don't confuse
Cwa vs Cfa. Both are humid subtropical with hot summers. Cwa has a dry winter (the North Indian plains); Cfa has rain in every season (the eastern United States). NCERT's Table 11.2 lists only Cfa, but its text describes both.
Cold snow-forest (D) and polar (E) climates
Cold snow-forest climates cover large continental areas of the northern hemisphere between 40° and 70° N, in Europe, Asia and North America. Df (cold climate with humid winters) lies poleward of the marine west coast and mid-latitude steppe climates: winters are cold and snowy, the frost-free season is short, and the annual range is large. Dw (cold climate with dry winters) lies mainly over north-eastern Asia, where a strong winter anticyclone that weakens in summer gives a monsoon-like reversal of winds. Many places stay below freezing for up to seven months, precipitation falls in summer, and NCERT gives the annual total as low, 12-15 cm.
Polar climates lie poleward of 70°. ET (tundra) is named after its vegetation of low-growing mosses, lichens and flowering plants. The subsoil is permanently frozen (permafrost), the growing season is short, waterlogging allows only low plants, and summer days are very long. EF (ice cap) covers interior Greenland and Antarctica, where even summer stays below freezing and little precipitation falls. The snow and ice pile up, the ice sheets deform under the pressure and break, and icebergs float off in Arctic and Antarctic waters. NCERT names Plateau Station, Antarctica (79° S) as an example.
Köppen's climate types as NCERT describes them
| Type (NCERT code) | Standard classes | Where (NCERT) | Regime (NCERT) | Vegetation (NCERT) |
|---|---|---|---|---|
| Tropical wet (Af) | Af | Amazon Basin; western equatorial Africa; East Indies | Rain every month, afternoon thundershowers; max about 30 °C, min about 20 °C | Evergreen forest, dense canopy |
| Tropical monsoon (Am) | Am | Indian sub-continent; NE South America; northern Australia | Heavy summer rain; dry winter | - |
| Tropical wet and dry (Aw) | Aw | N and S of the Amazon forest (Brazil, Bolivia, Paraguay); Sudan; south of Central Africa | Less, variable rain; long dry season | Deciduous forest; grassland with scattered trees |
| Subtropical steppe and desert (BSh, BWh) | BSh, BWh | 15°-35°; coastal deserts by cold currents | Highly variable rain in short thundershowers; very hot summers | Sparse grassland (steppe) |
| Mid-latitude steppe and desert (BSk, BWk) | BSk, BWk | 35°-60°, continental interiors | Where maritime-humid winds do not reach; often surrounded by mountains | - |
| Humid subtropical, dry winter (Cwa) | Cwa | North Indian plains; South China interior plains | Like Aw but warm winter | - |
| Mediterranean (Cs) | Csa, Csb, Csc | Mediterranean; central California; central Chile; SE and SW Australia | Hot dry summer about 25 °C; mild rainy winter below 10 °C; 35-90 cm | - |
| Humid subtropical (Cfa) | Cfa | Eastern USA; southern and eastern China; southern Japan; NE Argentina; eastern Australia | Rain all year; 75-150 cm; summer about 27 °C, winter 5-12 °C | - |
| Marine west coast (Cfb) | Cfb | NW Europe; west coast of North America north of California; southern Chile; SE Australia; New Zealand | Mild; summer 15-20 °C, winter 4-10 °C; 50-250 cm | - |
| Humid continental (Df) | Dfa, Dfb, Dfc, Dfd | Poleward of Cfb and mid-latitude steppe | Cold snowy winter; short frost-free season | - |
| Subarctic (Dw) | Dwa, Dwb, Dwc, Dwd | North-eastern Asia | Winter anticyclone; up to seven months below freezing; summer rain; 12-15 cm | - |
| Tundra (ET) | ET | Poleward of 70° | No true summer; permafrost; long summer days | Mosses, lichens, low flowering plants |
| Polar ice cap (EF) | EF | Interior Greenland; Antarctica (Plateau Station, 79° S) | Below freezing even in summer; little precipitation | Perennial ice (no vegetation listed) |
Source: NCERT, Fundamentals of Physical Geography, Class XI, ch 11 "World Climate and Climate Change" (Reprint 2026-27), Table 11.2 and text; standard classes from Beck et al. (2023), Scientific Data 10, 724, legend. "-" means NCERT gives no vegetation for the type.
NCERT also gives annual rainfall ranges for four of the mid- and high-latitude types. The chart below draws them on one scale, which shows at a glance how wide the marine west coast range is and how little the subarctic type receives.
Köppen's climates on today's maps
Until 2006, Kottek et al. note, most published Köppen maps were copies of the historical hand-drawn ones. Kottek et al. (2006), World Map of the Köppen-Geiger climate classification updated, Meteorologische Zeitschrift 15, 259-263 produced a digital world map on a 0.5° grid, computed from two observed data sets for 1951-2000: CRU TS 2.1 for temperature and GPCC VASClimO v1.1 for precipitation. Neither covers Antarctica, so it "has been set manually to the polar frost climate (EF)". After removing letter combinations that cannot occur, Kottek et al. note that "31 climate classes remain". Beck et al. (2023), Scientific Data 10, 724 produced the current maps: present-day maps for 1901-1930, 1931-1960, 1961-1990 and 1991-2020 at about 1 km resolution, with "five major classes and 30 sub-classes". Checked against weather stations, their classes were right 79.2% to 86.4% of the time across the four periods (79.2% for 1991-2020, 86.2% for 1901-1930). The map below is drawn from their 1991-2020 map at 0.5°.
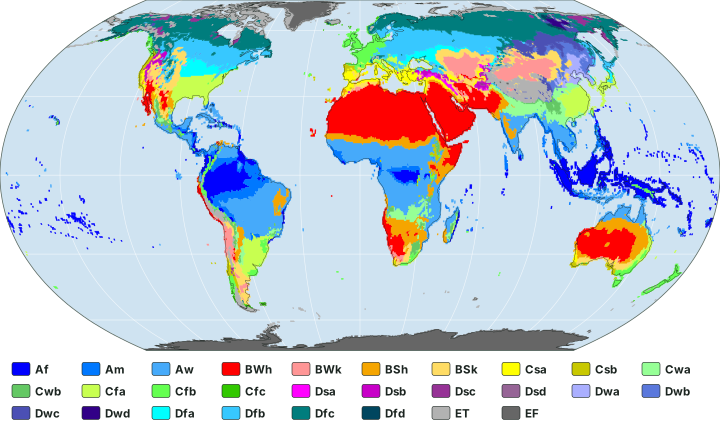
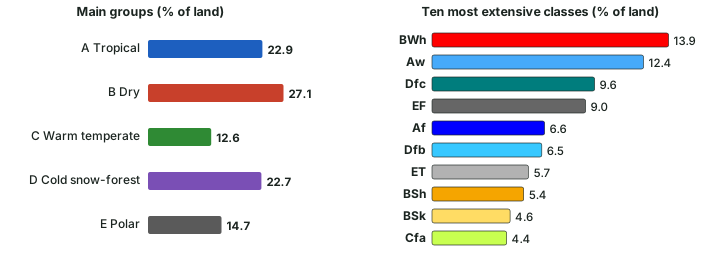
Counting the map's land cells, each weighted by its true area, gives the shares in the two charts below (computed for these notes). Dry climates (B) cover the most land, 27.1%, followed by tropical (A) 22.9%, cold snow-forest (D) 22.7%, polar (E) 14.7% and warm temperate (C) 12.6%. The most extensive single class is BWh at 13.9%, then Aw at 12.4%. EF is large (9.0%) because the ice sheets of Antarctica and Greenland count as land.
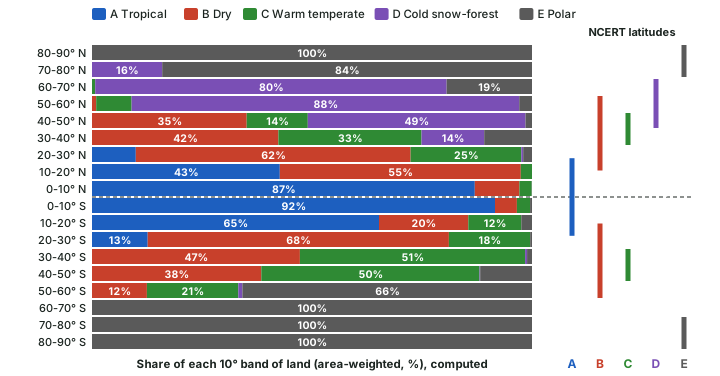
The bands follow NCERT's latitudes closely. Between the equator and 10° N, A covers 87% of the land; between 20° and 30° N, B covers 62%; between 50° and 60° N, D covers 88%; and between 70° and 80° N, E covers 84%. In the southern hemisphere D is almost absent: its largest share in any southern band is 0.9%.
Two modern Köppen-Geiger maps compared
| Kottek et al. (2006) | Beck et al. (2023) | |
|---|---|---|
| Period | 1951-2000 | 1901-1930, 1931-1960, 1961-1990, 1991-2020; projections for 2041-2070 and 2071-2099 |
| Data | CRU TS 2.1 temperature; GPCC VASClimO v1.1 precipitation | Seven observation-based climatic datasets; for the future, 42 of 67 climate models kept |
| Grid | 0.5° | About 1 km (0.01°), also coarser grids |
| Classes | 31 that can occur | Five major classes and 30 sub-classes |
| Antarctica | Set manually to EF | Mapped |
| Checked against stations | - | Accuracy 79.2% to 86.4% |
Source: Kottek et al. (2006), World Map of the Köppen-Geiger climate classification updated, Meteorologische Zeitschrift 15, 259-263; Beck et al. (2023), Scientific Data 10, 724. Kottek counts the classes that remain possible; Beck counts the classes in its legend.
Projection, not observation
Beck et al. also map Köppen-Geiger classes for 2041-2070 and 2071-2099 under seven emission scenarios. These are model projections, not observations: they show where climates may shift if the scenario comes true. The climate change part discusses the warming behind them.
Thornthwaite, briefly
Köppen is not the only scheme. Thornthwaite published "The Climates of North America: According to a New Classification" in the Geographical Review in 1931, and "An Approach toward a Rational Classification of Climate" in the same journal in 1948. For the examination, Köppen remains the scheme to know in detail; Thornthwaite is the standard example of an alternative.
Summary
- Weather is the state of the atmosphere; climate is weather averaged over many years. Climates are classified empirically (by data), genetically (by causes) or for an applied purpose.
- Köppen's first quantitative classification appeared in 1900 (his work on the Earth's thermal zones goes back to an 1884 paper); it was revised (NCERT dates it to 1918) and refined by Geiger (maps of 1954 and 1961). It ties climate limits to vegetation.
- Five groups: A (coldest month ≥ 18 °C), B (dry), C (−3 °C to 18 °C), D (≤ −3 °C), E (all months < 10 °C). Test E first, then B. The 2026-27 NCERT reprint has dropped the Highland group H.
- Second letters give the rain season (f, m, w, s) or, for B, steppe or desert (S, W); third letters give the temperature (h, k, a, b, c, d).
- On the 1991-2020 map, B covers the most land (27.1%, computed) and BWh is the largest single class.
Pairs to keep apart
| Pair | How to tell them apart |
|---|---|
| Empirical vs genetic | By measured values vs by causes |
| 1900 vs 1918 | First quantitative scheme (Kottek et al.) vs the version NCERT dates |
| A vs C vs D | Coldest month ≥ 18 °C; between −3 °C and 18 °C; ≤ −3 °C |
| ET vs EF | Warmest month 0-10 °C vs below 0 °C |
| BS vs BW | Rain above or below 5 Pth |
| h vs k | Annual mean ≥ 18 °C (hot) vs below (cold) |
| f vs w vs s | No dry season vs dry winter vs dry summer |
| Cwa vs Cfa | Dry winter (North Indian plains) vs rain all year (eastern USA) |
| NCERT codes vs standard codes | NCERT's Cs, Df, Dw stand for several standard classes |
| 31 vs 30 classes | Classes possible (Kottek et al.) vs classes mapped (Beck et al.) |
Source: NCERT, Fundamentals of Physical Geography, Class XI, ch 11 "World Climate and Climate Change" (Reprint 2026-27); Kottek et al. (2006), World Map of the Köppen-Geiger climate classification updated, Meteorologische Zeitschrift 15, 259-263; Beck et al. (2023), Scientific Data 10, 724.
Sources
Each table and data figure names its source beneath it. The main documents are collected here, with a date where the source carries one. Figures not listed under image credits were drawn for this page from the sources stated in their source lines.
Main sources
| Topic | Source |
|---|---|
| Textbook | NCERT, Fundamentals of Physical Geography, Class XI, ch 11 "World Climate and Climate Change" (Reprint 2026-27) |
| The Highland group (earlier edition) | NCERT, Fundamentals of Physical Geography, Class XI, ch 12 "World Climate and Climate Change" (2020 edition) |
| Weather and climate defined | US National Weather Service (NOAA) glossary: weather, climate |
| Köppen-Geiger criteria and the 1951-2000 world map | Kottek et al. (2006), World Map of the Köppen-Geiger climate classification updated, Meteorologische Zeitschrift 15, 259-263 |
| Köppen-Geiger maps for 1901-2020 and projections | Beck et al. (2023), Scientific Data 10, 724; map data: Beck, H.E. et al. (2023), High-resolution (1 km) Köppen-Geiger maps for 1901-2099 based on constrained CMIP6 projections, Scientific Data 10, 724; figshare doi 10.6084/m9.figshare.21789074, CC BY 4.0 |
| Thornthwaite's classifications | Thornthwaite, "The Climates of North America: According to a New Classification", Geographical Review 21, 633 (1931); Thornthwaite, "An Approach toward a Rational Classification of Climate", Geographical Review 38, 55 (1948) |
| Earth's axial tilt (23.4°) | NASA Science, page on Milankovitch (orbital) cycles |
Image credits
| Image | Credit and licence |
|---|---|
| All other figures | Drawn for this page from the sources given in their source lines. |