 BharatNotes
Part 3 of 10 of the El Niño and Climate Variability notes. The overview page has the quick revision and exam strategy for all ten parts.
El Niño and La Niña
Every few years the tropical Pacific leaves its normal state. The trade winds slacken, warm water spreads east and the rain follows it: that is El Niño. At other times the normal pattern is pushed harder, with stronger trades and colder water in the east: that is La Niña. This part explains what happens in each phase, why the system swings back and forth, how the swing is tied to the seasons, and what the great events of the last half-century looked like on NOAA's indices.
The names: El Niño, La Niña and ENSO
The name began with the sea off South America. NCERT's India: Physical Environment treats El Niño as a current that raises the temperature of water on the Peruvian coast, and explains that the word means "Child Christ" because this current "appears around Christmas in December". It adds that "December is a summer month in Peru (Southern Hemisphere)" (NCERT, India: Physical Environment, Class XI, ch. 4 "Climate" (2026-27 reprint)). The IPCC gives the dates scientists rely on: the Southern Oscillation "was named in 1924", and the first use of the name El Niño "to describe a climatic phenomenon appeared in South America in 1893" (IPCC AR6 WGI, Annex IV: Modes of Variability (2021)).
Two discoveries, one ocean and one atmospheric, were later found to be the same thing. El Niño is the warming of the ocean; the Southern Oscillation (see the tropical Pacific in its normal state) is the see-saw of air pressure between the eastern and western Pacific. NCERT puts the link plainly: "The combined phenomenon of southern oscillation and El Nino is known as ENSO" (NCERT, Fundamentals of Physical Geography, Class XI (2026-27 reprint), ch. 9). ENSO, the El Niño-Southern Oscillation, has three phases: El Niño (the warm phase), La Niña (the cool phase) and ENSO-neutral, the normal state described in part 6.2.
Remember
- El Niño = the ocean side, a warming of the central and eastern equatorial Pacific.
- Southern Oscillation = the atmospheric side, a see-saw of surface pressure across the Pacific.
- ENSO = the two together, one coupled system with three phases: El Niño, neutral and La Niña.
The three phases: ocean and atmosphere
El Niño
WMO describes El Niño as "a warming of ocean surface temperatures in the central and eastern Equatorial Pacific" (WMO, news release of 2 June 2026). NOAA's 1994 report sets out how the ocean responds when the trade winds retreat. The thermocline flattens, rising in the west and sinking in the east, "deep enough so that coastal upwelling is no longer able to tap the cold, nutrient-rich waters from beneath it". Equatorial upwelling also weakens, "further reducing the supply of nutrients to the food web"; "the cold tongue in sea-surface temperature weakens or disappears"; and the sea surface "flattens out, dropping in the west and rising in the east" (NOAA PMEL, El Niño and Climate Prediction, Reports to the Nation on Our Changing Planet (1994)).
The atmosphere follows the warm water. Climate.gov describes the warm pool beginning "to slosh to the east", with the rising branch of the Walker circulation following it. Over Indonesia and its neighbours, the Maritime Continent, "Instead of strong rising motion over the Maritime Continent, upward flow weakens, and anomalous sinking motion occurs", while "increased rising motion enhances rainfall over the central Pacific Ocean" (NOAA Climate.gov, "The Walker Circulation: ENSO's atmospheric buddy"). The western Pacific turns drier and the central and eastern Pacific wetter; the part on ENSO teleconnections follows these shifts around the world.
NCERT lists three results of El Niño: the distortion of the equatorial atmospheric circulation, "irregularities in the evaporation of sea water", and a "reduction in the amount of planktons which further reduces the number of fish in the sea" (NCERT, India: Physical Environment, Class XI, ch. 4 "Climate" (2026-27 reprint)). The last point follows directly from the weakened upwelling above: fewer nutrients reach the sunlit surface, so the food web off Peru thins out.
La Niña
La Niña is the normal state pushed harder. In NCERT's glossary, the "trade winds become very strong and an abnormal accumulation of cold water occurs in the central and eastern Pacific Ocean" (NCERT, Fundamentals of Physical Geography, Class XI (2026-27 reprint), glossary). Climate.gov describes the Walker circulation as "sent into overdrive", with waters "in the western Pacific are even warmer than normal and waters in the eastern Pacific are even colder" (NOAA Climate.gov, "The Walker Circulation: ENSO's atmospheric buddy"). The Bjerknes feedback explains why: stronger easterlies drive more upwelling, which sharpens the temperature contrast, which strengthens the easterlies again (see the diagram below).
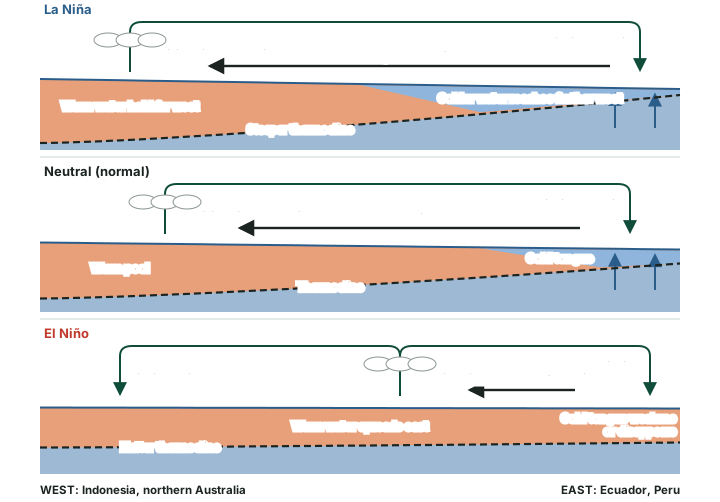
The table below sets the three phases side by side. The thresholds used to declare each phase belong to the indices, which the part on measuring and forecasting ENSO explains: on NOAA's indices an El Niño needs values of +0.5 °C or more, a La Niña -0.5 °C or less.
El Niño, neutral and La Niña compared
| Feature | La Niña (cool phase) | Neutral (normal) | El Niño (warm phase) |
|---|---|---|---|
| Trade winds | Stronger than normal | Normal easterlies | Weaker than normal |
| Warm water | Held far to the west | Warm pool in the west | Spreads east along the equator |
| Thermocline in the east | Shallower | Shallow | Deeper, too deep for upwelling to tap |
| Upwelling off Peru and Ecuador | Stronger | Strong | Weak |
| Central and eastern Pacific SST | Colder than normal | Normal (cold tongue) | Warmer than normal |
| Walker circulation | Strengthened ("sent into overdrive") | Rising west, sinking east | Rising branch shifts to the central Pacific |
| Rain | Heavier over the Maritime Continent | Heaviest over the warm pool | Moves to the central Pacific; west drier |
| Sea level across the Pacific | Steeper slope | Higher in the west | Flattens |
| SOI (BoM, part 6.4) | Sustained above +7 is typical | Between the thresholds | Sustained below -7 often indicates El Niño |
| NOAA index (part 6.4) | -0.5 °C or less | Between -0.5 and +0.5 °C | +0.5 °C or more |
Source: NOAA PMEL, El Niño and Climate Prediction, Reports to the Nation on Our Changing Planet (1994); NOAA Climate.gov, "The Walker Circulation: ENSO's atmospheric buddy"; NCERT, Fundamentals of Physical Geography, Class XI (2026-27 reprint), glossary; Bureau of Meteorology SOI thresholds as given in part 6.4. Where a La Niña cell says stronger, shallower or steeper, it applies the Bjerknes feedback of part 6.2 to the stronger trade winds.
Key idea
- El Niño: weak trades, flat thermocline, warm east, rain moves east.
- La Niña: strong trades, steep thermocline, cold east, rain held west.
- Ocean and atmosphere change together: neither leads alone, which is why ENSO is called a coupled system.
Why ENSO swings: the mechanisms
The Bjerknes feedback explains why a small warming can grow into an El Niño: weaker trades mean less upwelling, a warmer east and weaker trades again. A positive feedback alone would leave the Pacific stuck in one phase. Something must also end each event and turn the system the other way. Two ideas, both built on the ocean's slow memory, explain this.
Kelvin and Rossby waves
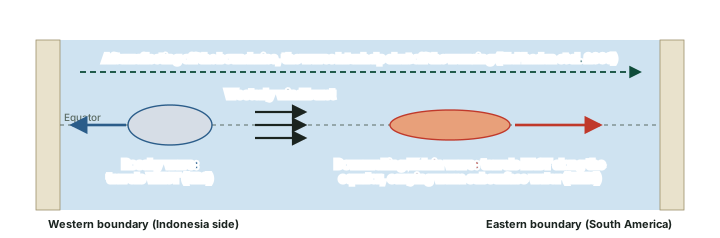
When the winds over the equatorial Pacific change, the ocean answers with waves that cross the whole basin. McPhaden and colleagues describe the start of an El Niño: "Weakened trade winds at the onset of El Niño generate basin-scale waves in sea level, upper ocean currents, and temperatures that rapidly propagate eastward and westward along the equator" (McPhaden, M. J., Zebiak, S. E. and Glantz, M. H. (2006), "ENSO as an Integrating Concept in Earth Science", Science 314, 1740-1745). The two kinds have names. WMO describes "eastward-propagating equatorial Kelvin waves, which transport warm subsurface water eastward across the tropical Pacific", and notes that "subsurface downwelling Kelvin waves" are tracked because they "precede and sustain El Niño events" (WMO Bulletin 75(2), "How Ocean Observations Help Us Understand and Forecast El Niño" (2026)). The IPCC describes "westward-propagating oceanic Rossby waves" (IPCC AR6 WGI, Annex IV: Modes of Variability (2021)) (see the diagram below).
Don't confuse
- Kelvin wave: travels east along the equator; a downwelling Kelvin wave carries warm water east and helps El Niño grow.
- Rossby wave: travels west; after reflection at the western edge of the basin its effect returns east and works against the warming.
- Both are basin-scale ocean waves (McPhaden et al. 2006), not the wind waves seen at a beach.
The delayed oscillator and the recharge-discharge oscillator
The delayed oscillator follows the waves. McPhaden and colleagues explain that the waves first "support the growth of anomalously warm SSTs", but after crossing the basin and reflecting off its edges they combine with waves forced by the winds at the height of El Niño to end the warming: "Equatorial wave-induced cooling thus represents a delayed negative feedback that brings about the demise of El Niño and, if strong enough, the initiation of La Niña" (McPhaden, M. J., Zebiak, S. E. and Glantz, M. H. (2006), "ENSO as an Integrating Concept in Earth Science", Science 314, 1740-1745). The delay is the travel time of the waves, so the brake arrives months after the push.
The recharge-discharge oscillator follows the heat. In Climate.gov's account, during neutral years "heat builds up in the subsurface ocean around the equator over many months or even years", like charging a battery. A trigger, such as a strong westerly wind burst, then releases it as El Niño, which discharges the heat away from the equator; the drained Pacific may then swing into La Niña before the store refills (NOAA Climate.gov ENSO blog, "The life and death of El Niño" (23 June 2016)) (see the diagram below).
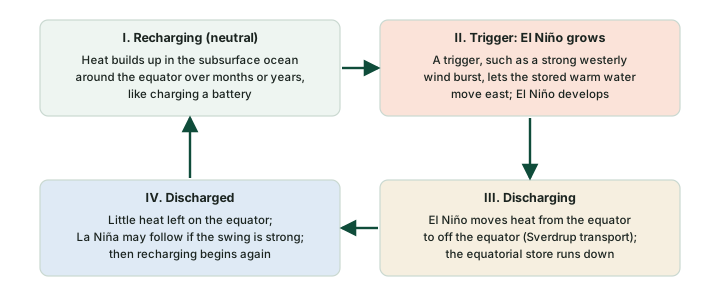
The two ideas are partners, not rivals. Climate.gov notes that "The recharge-discharge and delayed oscillator mechanisms are not mutually exclusive", and that "Recharge-discharge is more focused on the movement of heat from the equator to off the equator and vice versa, while delayed oscillator is focused more on the zonal (east-west) movement of heat" (NOAA Climate.gov ENSO blog, "The life and death of El Niño" (23 June 2016)) (see the table below).
Two explanations of the ENSO cycle
| Feature | Delayed oscillator | Recharge-discharge oscillator |
|---|---|---|
| Follows | Ocean waves crossing the basin | The store of warm water along the equator |
| Direction of heat movement | East-west (zonal) | Equator to off the equator, and back |
| Kelvin and Rossby waves | Invoked explicitly | Not invoked explicitly |
| What ends El Niño | Reflected waves bring a delayed negative feedback | The equatorial heat store is discharged |
| Relation to the other | Not mutually exclusive | Not mutually exclusive |
Source: McPhaden, M. J., Zebiak, S. E. and Glantz, M. H. (2006), "ENSO as an Integrating Concept in Earth Science", Science 314, 1740-1745; NOAA Climate.gov ENSO blog, "The life and death of El Niño" (23 June 2016), including its footnote on the two mechanisms.
Westerly wind bursts and irregularity
If ENSO were only an oscillator it would tick like a clock, but real events come at irregular intervals and with different strengths. Short bursts of westerly wind over the western Pacific can give a growing El Niño a push, or fail to arrive when one seemed likely. McPhaden and colleagues set out the two views of this irregularity: it may come "from either nonlinear chaotic dynamics of the ocean-atmosphere system or from stochastic forcing by weather noise", which includes "episodic 'westerly wind bursts'" (McPhaden, M. J., Zebiak, S. E. and Glantz, M. H. (2006), "ENSO as an Integrating Concept in Earth Science", Science 314, 1740-1745).
Hypothesis, not settled fact
Why ENSO is irregular is not settled. One view holds that the coupled ocean and atmosphere are chaotic in themselves; the other that random weather, such as westerly wind bursts, keeps kicking a damped oscillator. Both may play a part.
The life cycle, the seasons and the spring barrier
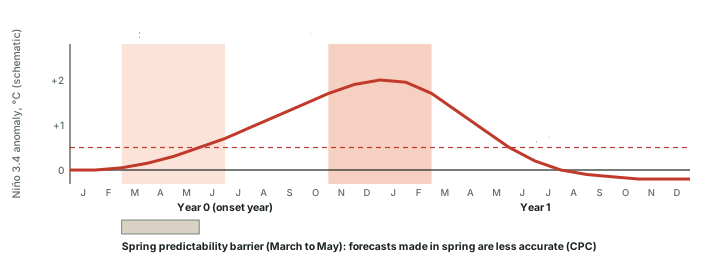
WMO sums up a typical El Niño: it "typically occurs every two to seven years and lasts around nine to twelve months", and it "generally begins developing between March and June and reaches its peak intensity between November and February" (WMO, news release of 2 June 2026). The seasons act as a clock for the whole system. In McPhaden and colleagues' words, "The mean seasonal cycle also acts as a pacemaker for ENSO, with the largest SST anomalies typically occurring near the end of the calendar year" (McPhaden, M. J., Zebiak, S. E. and Glantz, M. H. (2006), "ENSO as an Integrating Concept in Earth Science", Science 314, 1740-1745). This tie to the calendar is called seasonal phase-locking (see the diagram below).
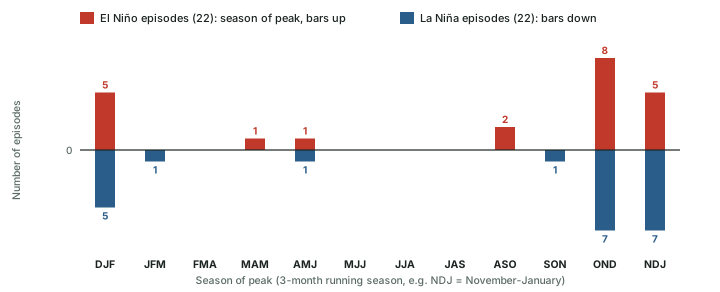
NOAA's record shows the lock clearly. Of the 22 El Niño episodes on the RONI since 1950, 18 reached their largest value in OND, NDJ or DJF, that is, between October and February; so did 19 of the 22 La Niña episodes (computed; see the chart below). The median El Niño episode on the RONI lasted 8.5 overlapping 3-month seasons, which spans about 10.5 months (computed), in line with WMO's nine to twelve months. Where two seasons tie for the largest value (1964 La Niña, AMJ 1964 and MJJ 1964 at -0.66 °C; 2016 La Niña, SON 2016 and OND 2016 at -0.96 °C), the count takes the earlier one.
The same seasonal clock makes ENSO hard to forecast in spring. NOAA's Climate Prediction Center states that "ENSO forecasts made during the spring are less accurate" (NOAA CPC, ENSO Diagnostic Discussion, 9 March 2023). Climate.gov explains why: in spring "it is difficult to know whether surface west-to-east ("westerly") wind anomalies across the tropical Pacific Ocean will continue through the summer and persist long enough to reinforce the developing El Niño", and "The heat in the subsurface tropical Pacific Ocean is a necessary precursor for El Niño but it is not always sufficient". Its record of April forecasts that favoured El Niño (1982, 1990, 1997, 2014, 2015 and 2018) shows that "4 of the 6 became El Niño events and 2 failed to form (1990, 2014)" (NOAA Climate.gov ENSO blog, "Why making El Niño forecasts in the spring is especially anxiety-inducing"). This is the spring predictability barrier.
Don't confuse: NCERT and research
- NCERT's numbers (NCERT, India: Physical Environment, Class XI, ch. 4 "Climate" (2026-27 reprint)): El Niño appears once every three to seven years. NCERT's glossary (NCERT, Fundamentals of Physical Geography, Class XI (2026-27 reprint)) says it lasts usually for a few weeks to a few months.
- WMO (2 June 2026): every two to seven years, lasting around nine to twelve months.
- The descriptions differ: NCERT's glossary entry centres on the coast of Ecuador and Peru, while WMO describes the warming of the central and eastern equatorial Pacific that NOAA's indices measure. In answers, give WMO's figures and name the source.
Exam tip
- Three seasonal facts to remember: develops March to June, peaks November to February, hardest to forecast in spring.
- A forecast made in April is weaker evidence than one made in July: say so when a question quotes an early forecast.
Two flavours: Eastern-Pacific and Central-Pacific El Niño
Not every El Niño warms the same stretch of ocean. In the classic, Eastern-Pacific type the largest warming sits in the east, near South America. In the Central-Pacific type the warmest water stays near the date line. Ashok et al. (2007) called this second pattern El Niño Modoki (Japanese for "similar but different"), describing a warm centre "flanked by a colder sea surface temperature anomaly (SSTA) on both sides along the equator" (see the map below).
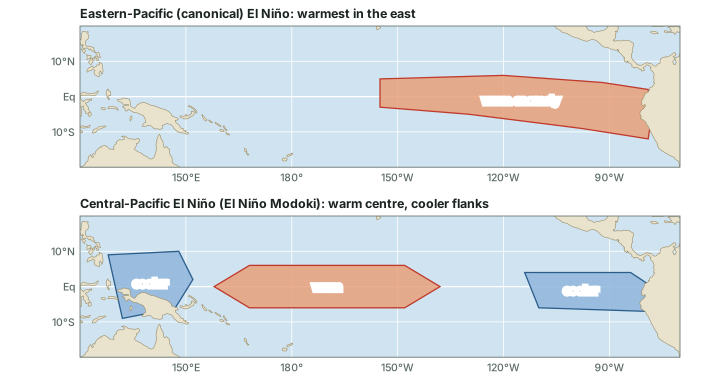
The difference matters because the two types move the rain differently. The IPCC notes that the type of event leads to different teleconnections, and that "stronger precipitation teleconnections occur over Australia during CP than during EP events" (IPCC AR6 WGI, Annex IV: Modes of Variability (2021)). The classification itself is unsettled: the IPCC concludes that "no robust consensus on the classification of CP or EP events is possible" (IPCC AR6 WGI, Annex IV: Modes of Variability (2021)), so different studies place the same event in different groups.
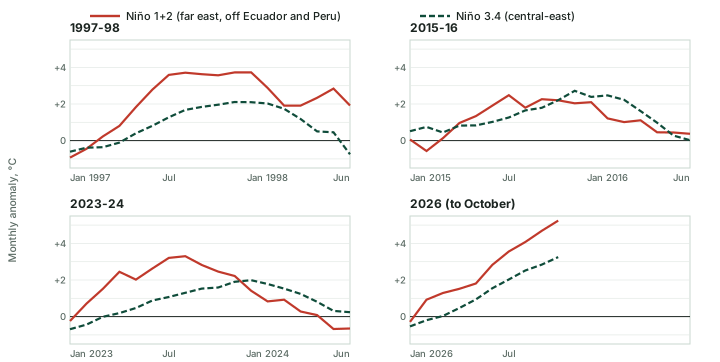
A simple way to see the difference is to compare the far-eastern Niño 1+2 region with the central-eastern Niño 3.4 region (the regions are shown on the Niño regions map). In 1997-98 the monthly Niño 1+2 anomaly reached +3.73 °C against +2.11 °C in Niño 3.4; in 2023-24 the figures were +3.30 °C and +1.99 °C; and in 2026, up to October, +5.25 °C and +3.25 °C (computed monthly anomalies; see the chart below). The chart shows how far east each event reached; it does not classify the events, for the reason the IPCC gives above.
At the far end of the range sit coastal Niño events, such as those of 1925 and 2017, "where abnormally warm waters are confined to the South American coast". The IPCC notes that these are "not conventionally classified as El Niños" (IPCC AR6 WGI, Annex IV: Modes of Variability (2021)).
Eastern-Pacific and Central-Pacific El Niño
| Feature | Eastern-Pacific (canonical) | Central-Pacific (Modoki) |
|---|---|---|
| Warmest water | Eastern Pacific, towards South America | Central Pacific, near the date line |
| Pattern along the equator | Warming grows from the centre to the coast | Warm centre flanked by cooler water on both sides |
| Region that warms most | Far east (Niño 1+2 and Niño 3) | Central (Niño 3.4 and westward) |
| Rain over Australia | Weaker precipitation teleconnection | Stronger precipitation teleconnection |
| Named by | The original, canonical form | Ashok et al. (2007): "El Niño Modoki" |
| Classification | No robust consensus on which events belong where (IPCC AR6) | No robust consensus on which events belong where (IPCC AR6) |
Source: IPCC AR6 WGI, Annex IV: Modes of Variability (2021); Ashok et al. (2007). The row on regions is a general guide drawn from the patterns, not an official rule.
The great El Niño events
Which El Niño was the strongest? The answer depends on the index. Since 1 February 2026 NOAA's official measure is the relative ONI (RONI), which removes the warming of the whole tropics; the legacy ONI (ERSSTv6) is still published (the part on measuring and forecasting ENSO explains both). The 1982-83 event peaked at 2.40 °C on the RONI (DJF 1982-83) and 2.14 °C on the legacy ONI (DJF 1982-83); 1997-98 at 2.28 °C on the RONI (NDJ 1997-98) and 2.37 °C on the legacy ONI (NDJ 1997-98); and 2015-16 at 2.25 °C on the RONI (NDJ 2015-16) and 2.59 °C on the legacy ONI (NDJ 2015-16) (all computed, values as of November 2026; NOAA revises them when datasets change). Of the six events in the chart below, 1982-83 is the highest on the RONI and 2015-16 on the legacy ONI (computed).
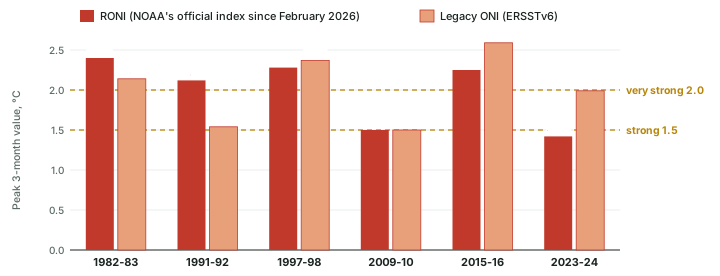
The 2023-24 event shows the gap most clearly: 1.42 °C on the RONI (OND 2023) and 1.99 °C on the legacy ONI (NDJ 2023-24) (computed). On the RONI it stayed below the strong threshold; on the legacy ONI it was strong. The RONI is lower because it subtracts the warming of the tropics as a whole (part 6.4 gives the formula). The 2009-10 event peaked at 1.50 °C on the RONI (NDJ 2009-10) and 1.50 °C on the legacy ONI (NDJ 2009-10) (computed): exactly on the strong threshold, so a small revision to either index could move it across the line.
NCERT calls the El Niño of 1990-91 "wild" and records that the onset of the south-west monsoon was delayed over most parts of India by five to twelve days (NCERT, India: Physical Environment, Class XI, ch. 4 "Climate" (2026-27 reprint)). NOAA's indices tell a fuller story. In late 1990 the values were small (NDJ 1990-91: +0.34 °C on the legacy ONI, +0.43 °C on the RONI, computed), while the event that followed in 1991-92 peaked at 2.12 °C on the RONI (DJF 1991-92) and 1.54 °C on the legacy ONI (DJF 1991-92) (computed). "Wild" is NCERT's word; on NOAA's indices the large event came a year later.
Remember
- Strength labels need a threshold and an index. The WMO Bulletin uses 1.5 °C for strong and 2.0 °C for very strong in Niño 3.4 (WMO Bulletin 75(2), "How Ocean Observations Help Us Understand and Forecast El Niño" (2026)).
- Always name the index: 2.40 °C on the RONI and 2.14 °C on the legacy ONI are the same event, 1982-83 (computed).
- Values are as of November 2026; NOAA revises them when datasets change.
News reports often call the largest events a "super El Niño". WMO does not: "WMO does not use the term "super El Niño" because it is not part of standardized operational classifications" (WMO, news release of 2 June 2026). In examinations and answers, use the agencies' terms: strong or very strong, with the index and its value.
La Niña and the 2020-23 triple dip
La Niña conditions can persist through more than one northern winter. The most recent long run began in 2020. On 10 September 2020 NOAA's Climate Prediction Center announced that "La Niña conditions are present and are likely to continue through the Northern Hemisphere winter (~75% chance)" (NOAA CPC, ENSO Diagnostic Discussion, 10 September 2020). On 1 March 2023 WMO wrote that "The first triple-dip La Niña of the 21st century is finally coming to an end" (WMO, El Niño/La Niña Update news release, 1 March 2023), and on 9 March 2023 CPC declared that "La Niña has ended and ENSO-neutral conditions are expected to continue through the Northern Hemisphere spring and early summer 2023" (NOAA CPC, ENSO Diagnostic Discussion, 9 March 2023).
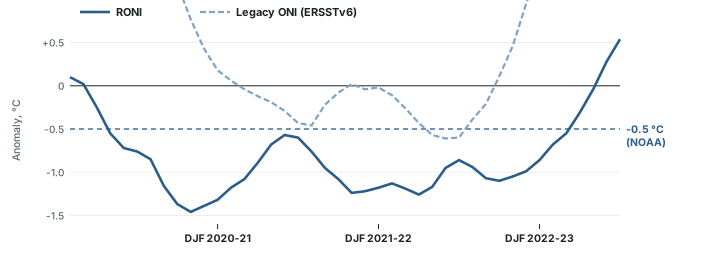
A triple dip means La Niña in three northern winters in a row; WMO wrote of "three consecutive years of an unusually stubborn and protracted La Niña" (WMO, El Niño/La Niña Update news release, 1 March 2023). The RONI for the northern winters (DJF) was -1.32 °C in 2020-21, -1.18 °C in 2021-22, -0.86 °C in 2022-23 (computed). On the RONI the cool run is unbroken: 35 overlapping seasons from AMJ 2020 to FMA 2023, with its lowest value, -1.46 °C, in OND 2020 (computed). On the legacy ONI the same years break into two runs, because the index rose above -0.5 °C from AMJ 2021 to JAS 2021 (highest -0.31 °C, computed) (see the chart below). The qualifier "of the 21st century" in WMO's statement matters: WMO did not call it the first ever.
Don't confuse
- Triple-dip La Niña: three successive northern winters of La Niña (2020-21, 2021-22 and 2022-23).
- One long event or two? It depends on the index: unbroken on the RONI, broken in 2021 on the legacy ONI (computed).
- An Advisory is issued while conditions are present; a Final Advisory says they have ended (see the ENSO Alert System).
Summary
- El Niño is the warm phase of ENSO: weak trades, a flat thermocline, a warm eastern Pacific and rain shifted east. La Niña is the normal state strengthened.
- The Bjerknes feedback makes events grow; Kelvin and Rossby waves and the discharge of equatorial heat end them (the delayed and recharge-discharge oscillators, not mutually exclusive).
- Events develop from March to June and peak from November to February; spring forecasts are the least reliable.
- Eastern-Pacific and Central-Pacific (Modoki) events warm different parts of the ocean and move rain differently; their classification is unsettled.
- "Strongest" depends on the index: name the RONI or the legacy ONI with every value.
- The 2020-23 La Niña covered three winters; WMO called it the first triple dip of the 21st century.
Sources
Each table and data figure names its source beneath it. The main documents are collected here, with a date where the source carries one. Figures not listed under image credits were drawn for this page from the sources stated in their source lines.
Main sources
| Topic | Source |
|---|---|
| The name El Niño; effects of El Niño; the 1990-91 event; NCERT's frequency | NCERT, India: Physical Environment, Class XI, ch. 4 "Climate" (2026-27 reprint) |
| ENSO defined; La Niña; NCERT's duration | NCERT, Fundamentals of Physical Geography, Class XI (2026-27 reprint), ch. 9 and glossary |
| Naming dates (1924, 1893); Rossby waves; Central-Pacific and Eastern-Pacific events; coastal Niño | IPCC AR6 WGI, Annex IV: Modes of Variability (2021) |
| El Niño defined; its frequency, duration and timing; "super El Niño" | WMO, news release of 2 June 2026 |
| The ocean in El Niño | NOAA PMEL, El Niño and Climate Prediction, Reports to the Nation on Our Changing Planet (1994) |
| The Walker circulation in El Niño and La Niña | NOAA Climate.gov, "The Walker Circulation: ENSO's atmospheric buddy" |
| Equatorial waves, the delayed oscillator, irregularity, seasonal pacemaker | McPhaden, M. J., Zebiak, S. E. and Glantz, M. H. (2006), "ENSO as an Integrating Concept in Earth Science", Science 314, 1740-1745 |
| Kelvin waves; strength thresholds | WMO Bulletin 75(2), "How Ocean Observations Help Us Understand and Forecast El Niño" (2026) |
| The recharge-discharge oscillator | NOAA Climate.gov ENSO blog, "The life and death of El Niño" (23 June 2016) |
| The spring predictability barrier | NOAA CPC, ENSO Diagnostic Discussion, 9 March 2023; NOAA Climate.gov ENSO blog, "Why making El Niño forecasts in the spring is especially anxiety-inducing" |
| El Niño Modoki | Ashok et al. (2007) |
| RONI and legacy ONI peaks; episode counts | NOAA Climate Prediction Center, Relative Oceanic Niño Index (RONI.ascii.txt); NOAA Climate Prediction Center, legacy Oceanic Niño Index, ERSSTv6 (oni.ascii.txt); values as of November 2026 |
| Monthly Niño 1+2 and Niño 3.4 anomalies | NOAA Climate Prediction Center, monthly Niño region SST indices (sstoi.indices), values as of November 2026 |
| The 2020-23 triple-dip La Niña | NOAA CPC, ENSO Diagnostic Discussion, 10 September 2020; WMO, El Niño/La Niña Update news release, 1 March 2023; NOAA CPC, ENSO Diagnostic Discussion, 9 March 2023 |
Image credits
| Image | Credit and licence |
|---|---|
| All other figures | Drawn for this page from the sources given in their source lines. |