 BharatNotes
Part 5 of 10 of the El Niño and Climate Variability notes. The overview page has the quick revision and exam strategy for all ten parts.
ENSO Around the World
An El Niño is born in the equatorial Pacific, yet farmers in southern Africa, fishermen in Peru, fire crews in Indonesia and coral reefs across three oceans all feel it. This part follows those links: how a patch of warm water shifts rain belts thousands of kilometres away, which regions tend to get wetter or drier in El Niño and La Niña, and what that means for global temperature, tropical cyclones, fisheries, reefs, health and economies.
Cross-paper relevance
- GS1 (Geography, primary): teleconnections, the regions El Niño and La Niña tend to make wetter or drier, El Niño and the global mean temperature, tropical cyclones basin by basin
- GS3 (Environment): coral reefs and the four global coral bleaching events; the collapse of the Peruvian anchoveta fishery under heavy fishing and El Niño together
- GS3 (Disaster management): drought and forest fires in Indonesia and Australia, floods on the desert coast of Ecuador and Peru, and the shift in where tropical cyclones form
How a Pacific event reaches the rest of the world
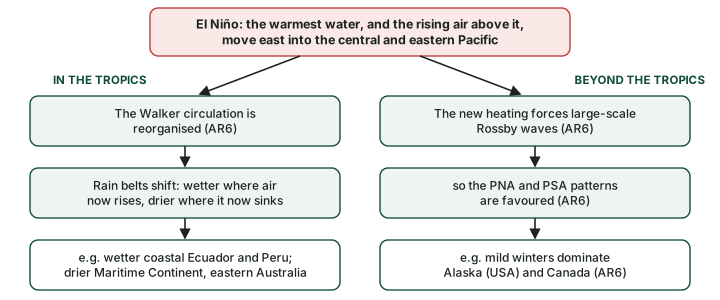
A teleconnection is a link between climate in places far apart, carried through the atmosphere or the ocean. ENSO is a powerful source of them. The reason is simple: in an El Niño the warmest ocean water in the tropics, and the towering rain clouds that grow over it, move east from the western Pacific towards the central and eastern Pacific (El Niño and La Niña). Rising air releases a great deal of heat as its vapour condenses into rain, so moving the rain means moving a huge heat source in the atmosphere.
IPCC AR6 (Working Group I, Annex IV, the annex on modes of variability) describes two routes by which that shift spreads (IPCC AR6 WGI Annex IV):
- Within the tropics, through "a reorganization of the zonal Walker circulation": air now rises over the warm central and eastern Pacific and sinks where it used to rise, so rain belts across the tropics shift.
- Beyond the tropics, through "forced large-scale Rossby waves": the new heating sets off large waves in the atmosphere that carry the signal into middle latitudes. AR6 notes that ENSO favours particular phases of the Pacific-North American (PNA) pattern in the north and the Pacific-South American (PSA) pattern in the south (the part on decadal and extratropical modes describes the PNA).
Why it happens
Air that rises over warm water cools, its vapour condenses, and the latent heat released warms the air column. That heating drives the circulation around it. Move the warm water east, and the rising branch of the Walker circulation moves with it; the regions that lose their rising air (the Maritime Continent, eastern Australia) turn drier, and those that gain it (the coast of Ecuador and Peru) turn wetter.
The Walker circulation itself is taught in the tropical Pacific in its normal state. Here the question is only: which places tend to change, and how?
El Niño's regional fingerprints
IPCC AR6 gives the standard list of where El Niño tends to change rainfall (IPCC AR6 WGI Annex IV):
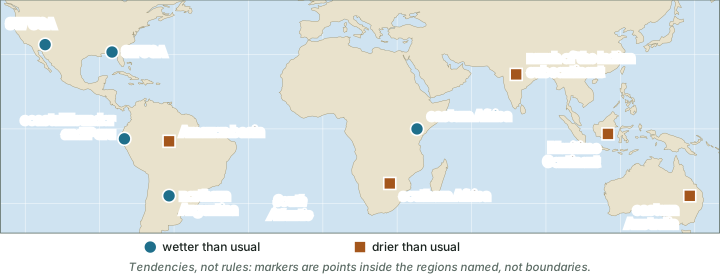
- Wetter than usual: the south-western and south-eastern United States, eastern Africa, coastal Ecuador and Peru, and northern Argentina.
- Drier than usual: eastern Australia and the Maritime Continent (Indonesia and its neighbouring islands), southern Africa, the Amazon basin (Brazil and its neighbours) and much of the Indian subcontinent.
The map below places these regions. Read every such map as a statement of odds. The World Meteorological Organization (WMO) stresses that "Each El Niño event is unique in terms of its evolution, spatial pattern and impacts", and that "Not all regions of the world are affected" (WMO, 2 June 2026).
WMO's June 2026 release, drawing on a study by Lenssen and colleagues (2020), gives a similar list in plainer words: El Niño brings more rain to parts of southern South America, the southern United States, parts of the Horn of Africa and central Asia, and drier conditions to Central America, northern South America, the Caribbean, Australia, Indonesia and parts of southern Asia (WMO, 2 June 2026). The two lists agree on the big picture; they differ in how finely they draw the regions.
North America in winter. Through the Rossby-wave route, AR6 notes that during El Niño "mild winter conditions dominate Alaska/Canada", linked to a deeper Aleutian Low that is displaced towards the south-east. NOAA's Climate Prediction Center describes the matching pattern farther south: in El Niño winters a strong jet stream and storm track run across the southern United States, while La Niña winters tend to be warmer and less stormy across the South (NOAA CPC, ENSO winter impacts over North America).
Don't confuse: NCERT vs IPCC AR6
NCERT's version and the research version. NCERT's Fundamentals of Physical Geography (Class XI, chapter 9 "Atmospheric Circulation and Weather Systems", 2026 reprint) says that in an El Niño "The arid west coast of South America receives heavy rainfall, drought occurs in Australia and sometimes in India and floods in China", and that ENSO is "used for long range forecasting in major parts of the world". This is a good first summary. IPCC AR6 is more exact: it names eastern Australia, adds the Maritime Continent, southern Africa and the Amazon to the dry list, and eastern Africa, the southern United States and northern Argentina to the wet list. AR6's list does not name China. For India, ENSO, IOD and the Indian monsoon sets out the record year by year.
Exam tip
East Africa and southern Africa respond in opposite ways. In El Niño, eastern Africa tends to be wetter and southern Africa drier (AR6). Lumping "Africa" together is a common mistake. The Indian Ocean Dipole part adds that a positive Indian Ocean Dipole also wets eastern Africa.
ENSO rainfall and temperature tendencies by region (tendency, not rule)
| Region | El Niño | La Niña | Source |
|---|---|---|---|
| South-western and south-eastern USA | Wetter | Broadly the reverse (AR6) | AR6 |
| Coastal Ecuador and Peru | Wetter | Broadly the reverse (AR6) | AR6 |
| Northern Argentina | Wetter | Broadly the reverse (AR6) | AR6 |
| Large parts of South America | - | Drought (2020-23 La Niña) | WMO 2023 |
| Amazon basin | Drier | Broadly the reverse (AR6) | AR6 |
| Eastern Africa (Greater Horn) | Wetter | Drought (2020-23 La Niña) | AR6; WMO 2023 |
| Southern Africa | Drier | Broadly the reverse (AR6) | AR6 |
| Much of the Indian subcontinent | Drier | Broadly the reverse (AR6); India in part 6.9 | AR6 |
| Maritime Continent / South East Asia | Drier | Above-average rain (2020-23 La Niña) | AR6; WMO 2023 |
| Eastern Australia / Australasia | Drier | Above-average rain (2020-23 La Niña) | AR6; WMO 2023 |
| Alaska (USA) and Canada, winter | Mild winters | - | AR6 |
Source: IPCC AR6 WGI Annex IV, section AIV.2.3; WMO, 1 March 2023. "-" means the source gives no tendency for that phase.
La Niña: broadly the reverse
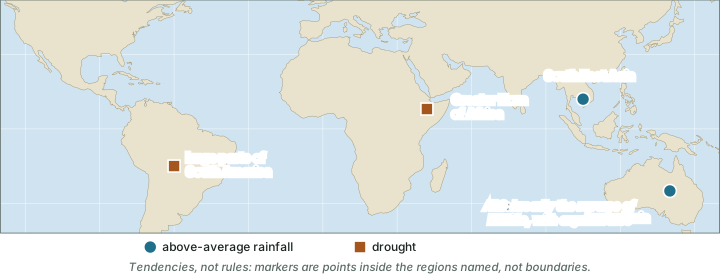
For La Niña, AR6 says only that "A general reverse association is found during La Niña events although there are some asymmetries" (IPCC AR6 WGI Annex IV). In other words, the regions that dry out in El Niño tend to get wetter in La Niña, and the reverse, but not by the same amount and not always in exactly the same places. WMO, describing the long La Niña of 2020-23, linked it to "the persistent drought in the Greater Horn of Africa and large parts of South America as well as above average rainfall in South East Asia and Australasia" (WMO, 1 March 2023).
Remember
The Greater Horn of Africa (Kenya, Ethiopia, Somalia and their neighbours) tends to be wet in El Niño and dry in La Niña. The 2020-23 drought there came with La Niña, not El Niño.
El Niño and the global temperature
An El Niño spreads unusually warm water across a vast area of the tropical Pacific, and that ocean gives heat to the atmosphere. AR6 calls ENSO the "main modulator of the global surface temperature at interannual time scales" (IPCC AR6 WGI Annex IV). El Niño years run warmer than the long-term trend, La Niña years cooler.
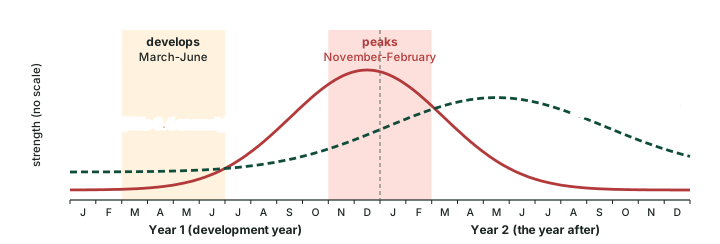
The effect lags the event. WMO explains that El Niño "generally begins developing between March and June and reaches its peak intensity between November and February, with impacts on global temperatures typically being most pronounced in the second year after development" (WMO, 2 June 2026). The diagram below draws that timing.
Two recent episodes show the effect. When the 2020-23 La Niña ended, WMO wrote that "La Niña's cooling effect put a temporary brake on rising global temperatures", and that if El Niño now developed, it was "likely to fuel another spike in global temperatures" (WMO, 1 March 2023). In June 2026 WMO looked back: "The most recent El Niño, in 2023-24, was one of the five strongest on record and it played a role in the record global temperatures we saw in 2024" (WMO, 2 June 2026). Note that "strongest" depends on the index: on NOAA's relative ONI (RONI) the 2023-24 peak was +1.42 °C (computed, OND 2023), against 2.0 on the ONI, because RONI measures Niño 3.4 against the rest of the tropics, which were also warm (ENSO indices and forecasts).
ENSO adds year-to-year ups and downs on top of a long-term rise; it does not cause the rise. The record years themselves, and the warming trend, are covered in the BharatNotes page "Climate Change", and El Niño in a warming world discusses ENSO in a warming world.
Key idea
El Niño warms the globe for a year or so; La Niña cools it for a year or so. Neither changes the long-term trend, which comes from greenhouse gases. WMO finds no evidence that climate change is making El Niño more frequent or intense, though it can amplify El Niño's impacts (part 6.10).
Tropical cyclones, basin by basin
Tropical cyclones are called hurricanes in the Atlantic and eastern Pacific and typhoons in the western North Pacific. AR6 states that El Niño brings "reduced tropical cyclone activity in the North Atlantic, and an eastward displacement of western North Pacific and South Pacific tropical cyclone genesis away from the Philippine Sea and the Australian continent and into the central Pacific" (IPCC AR6 WGI Annex IV). WMO adds: "During the Boreal summer, El Niño's warm water can fuel hurricanes in the central/eastern Pacific Ocean, while it hinders hurricane formation in the Atlantic Basin" (WMO, 2 June 2026).
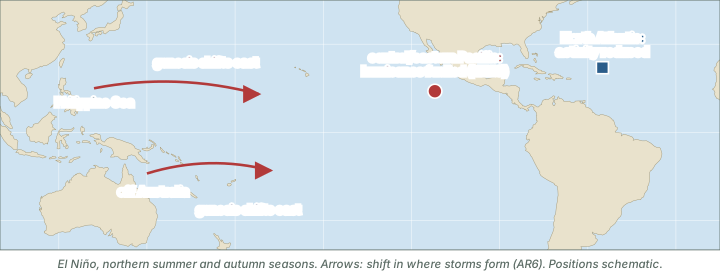
El Niño and tropical cyclones by basin (tendency, not rule)
| Basin | Tendency in El Niño | Source |
|---|---|---|
| North Atlantic | Reduced activity; formation hindered in boreal summer | AR6; WMO 2026 |
| Central and eastern North Pacific | Hurricanes fuelled in boreal summer | WMO 2026 |
| Western North Pacific | Genesis shifts east, away from the Philippine Sea | AR6 |
| South Pacific | Genesis shifts east, away from Australia, into the central Pacific | AR6 |
Source: IPCC AR6 WGI Annex IV; WMO, 2 June 2026.
The sources used here give no ENSO tendency for the Bay of Bengal and the Arabian Sea. The Madden-Julian Oscillation part shows how the Madden-Julian Oscillation affects where and when storms form there. How cyclones form is taught in the BharatNotes page on the monsoon, jet streams and tropical cyclones.
Fisheries: the Peruvian anchoveta
In normal years, steady trade winds drive cold, nutrient-rich water up along the coast of Peru (the tropical Pacific in its normal state). The nutrients feed plankton, and the plankton feed vast shoals of anchoveta (Peruvian anchovy). NCERT names the change: "Such appearance of warm water off the coast of Peru is known as the El Nino" (Fundamentals of Physical Geography, Class XI, chapter 9, 2026 reprint). The warm surface layer caps the upwelling, the food chain at its base thins out, and the fish scatter or die.
NOAA's Pacific Marine Environmental Laboratory (PMEL) pointed out in 1994 that Peru suffers at both ends of the cycle, as the diagram below shows.

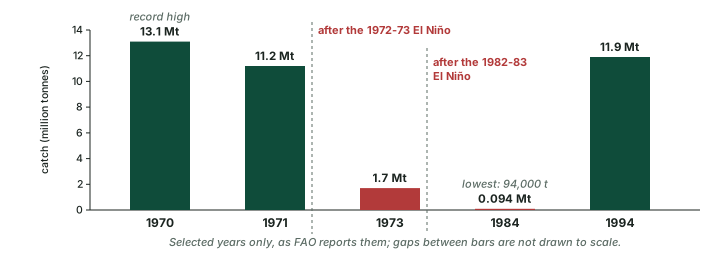
The anchoveta fishery shows how climate and human pressure combine. McPhaden, Zebiak and Glantz (Science 314, 1740-1745, 2006) describe it as the largest fishery in the world in the early 1970s, yielding over 12 million tonnes a year; after a decade of overfishing, the 1972-73 El Niño brought a collapse, and harvests over the following 20 years were an order of magnitude lower. The Food and Agriculture Organization (FAO) gives the catch in key years (chart below): a record 13.1 million tonnes in 1970, 11.2 million in 1971 and a then-record low of 1.7 million in 1973. FAO judges that heavy fishing played a major role, and that the 1972-73 El Niño "was a primary cause of recruitment failure and stock decline". The 1982-83 El Niño had a less severe impact because the stock was already depleted, but the stock still fell to its historical minimum: the 1984 catch was only 94,000 tonnes. By 1994 the catch was back to 11.9 million tonnes (FAO Fisheries Circular 920).
Worked example: the anchoveta collapse
The catch fell from 13.1 million tonnes in 1970 to 1.7 million tonnes in 1973, and stood at 94,000 tonnes in 1984 (FAO). By what percentage did it fall from 1970 to 1973, and what share of the 1970 catch was the 1984 catch?
- Fall = (13.1 − 1.7) ÷ 13.1 × 100.
- = 11.4 ÷ 13.1 × 100 ≈ 87 %.
- 94,000 tonnes = 0.094 million tonnes.
- Share = 0.094 ÷ 13.1 × 100 ≈ 0.7 %.
Answer: the catch fell by about 87 % between 1970 and 1973, and the 1984 catch was under 1 % (about 0.7 %) of the 1970 record (computed from FAO figures).
Remember
The anchoveta collapse of 1972-73 had two causes acting together: years of heavy fishing and the El Niño. Answers that blame El Niño alone miss half the story.
Coral reefs and mass bleaching
Reef-building corals live with tiny algae in their tissues that supply much of their food. When the water stays too warm for too long, the partnership breaks down, the coral expels the algae and turns white: this is bleaching. Corals can recover if the heat eases, but long or repeated heat stress kills them. El Niño spreads warm water across the tropics, which is why global bleaching events line up with it.
NOAA counts four global coral bleaching events: the first in 1998, the second in 2010, the third in 2014-2017 and the fourth from early 2023, which NOAA confirmed on 15 April 2024. NOAA reports that "From early-2023 to mid-2025, bleaching-level heat stress impacted 84% of the world's coral reef area in all three coral reef-containing ocean basins"; that mass bleaching "was documented in at least 83 countries and territories"; and that the event likely ended in mid-2025. The 84 % is the share of reef area exposed to bleaching-level heat, not the share that bleached. NOAA adds: "Since 1998, global coral bleaching events have coincided with every strong El Niño event" (NOAA NESDIS, 2 June 2026).
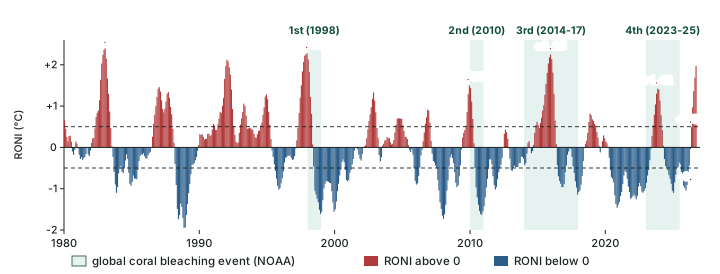
The computed RONI peaks in the chart above are +2.40 °C for 1982-83, +2.28 °C for 1997-98, +1.50 °C for 2009-10, +2.25 °C for 2015-16 and +1.42 °C for 2023-24. The 2009-10 event peaked near 1.5 °C, so whether it counts as strong depends on the index used (ENSO indices and forecasts). El Niño in a warming world returns to marine heatwaves in a warming ocean.
Fire, health and the economy
Fire. Drought on land dries out forests and peat. Among ENSO's impacts, AR6 names the "devastating extreme fire emissions in Indonesia in 2015", during the 2015-16 El Niño (IPCC AR6 WGI Annex IV).
The 1982-83 case. PMEL's 1994 report gives a rounded picture of one great event (table below). All values are as reported in 1994.
Impacts attributed to the 1982-83 El Niño (as reported by NOAA PMEL, 1994)
| Sector | What happened |
|---|---|
| Rain on a desert coast | Up to 100 inches (about 2.5 m) of rain in six months in Ecuador and northern Peru turned the coastal desert into grassland dotted with lakes |
| Marine life | By mid-1983, when conditions on the Peruvian coast returned to normal, 25 % of the year's fur seal and sea lion adults and all the pups had died |
| Fisheries | The anchovy harvest of Ecuador and Peru failed, and sardines moved south into Chilean waters |
| Health | In flooded coastal estuaries, cases of mosquito-borne malaria set records (as did shrimp production) |
| Storms | Typhoons steered to islands such as Hawaii (USA) and Tahiti (French Polynesia); winter storms battered southern California (USA) |
| Drought and fire | Droughts and disastrous forest fires in Indonesia and Australia |
| World economy | Loss of over $8 billion (estimate as of 1994) |
Source: NOAA PMEL, El Niño and Climate Prediction (Reports to the Nation, 1994).
The health line shows how one change of weather cuts both ways: floods brought standing water and mosquitoes, and also record shrimp. The economic figure is an estimate published in 1994; it is useful as a sense of scale, not as a current estimate.
Exam tip
When writing about impacts, pair each one with its mechanism: Indonesia's fires (rising air moved east, so drought); Peru's fish (upwelling capped by warm water); coral bleaching (prolonged heat stress); Atlantic hurricanes (fewer in El Niño). A mechanism-plus-example answer is stronger than a bare list.
Every event is different
No two El Niños are alike. They differ in strength, in where the warmest water sits (the Eastern-Pacific and Central-Pacific flavours of El Niño and La Niña) and in what other modes are doing at the same time: a positive Indian Ocean Dipole, the Pacific Decadal Oscillation or the season's own weather can strengthen, weaken or override the usual pattern. That is why WMO writes that "Not all regions of the world are affected" and why every teleconnection in this part is a tendency, not a rule. WMO also states that there is no evidence that climate change increases the frequency or intensity of El Niño events, though it can amplify their impacts (WMO, 2 June 2026).
The 2026 El Niño (as of mid-November 2026)
As of mid-November 2026 a strong El Niño was under way. NOAA's RONI stood at +1.97 °C for ASO 2026 (August-October), and the weekly Niño 3.4 anomaly was about +2.5 °C. NOAA judged a strong-to-very strong El Niño likely to last through January-March 2027. In its El Niño Advisory of 12 November 2026, NOAA's Climate Prediction Center gave about a 60 % chance that the event would become the strongest since 1950 (a 3-month RONI of +2.5 °C or more) in October-December or November-January: a forecast, not an outcome (NOAA CPC ENSO diagnostic discussion). Australia's Bureau of Meteorology said on 10 November 2026 that "A strong to very strong El Niño is underway"; its October monthly value was still below the record (Bureau of Meteorology, 10 November 2026). El Niño in a warming world gives the full 2026 status; ENSO, IOD and the Indian monsoon covers India's 2026 monsoon.
Summary
- ENSO reaches distant regions in two ways: a reorganised Walker circulation in the tropics, and forced Rossby waves beyond them (AR6).
- El Niño tends to wet the south-western and south-eastern USA, eastern Africa, coastal Ecuador and Peru and northern Argentina, and to dry eastern Australia, the Maritime Continent, southern Africa, the Amazon and much of the Indian subcontinent (AR6). La Niña is broadly the reverse, with asymmetries.
- El Niño raises the global mean temperature, most clearly in the year after it develops (WMO).
- El Niño reduces North Atlantic hurricane activity, fuels central/eastern Pacific hurricanes and shifts western Pacific and South Pacific cyclone genesis east.
- The 1972-73 anchoveta collapse came from overfishing and El Niño together (FAO).
- Through the 2023-24 El Niño, every strong El Niño since 1998 coincided with a global coral bleaching event (NOAA, 2 June 2026).
El Niño vs La Niña around the world at a glance (tendency, not rule)
| Aspect | El Niño | La Niña |
|---|---|---|
| Tropical rainfall | Shifts east: wetter coastal Ecuador and Peru; drier Maritime Continent and eastern Australia | Broadly the reverse, with asymmetries |
| Africa | Eastern Africa wetter; southern Africa drier | Greater Horn drought (2020-23) |
| South Asia | Much of the Indian subcontinent drier (part 6.9) | Broadly the reverse |
| Global mean temperature | Raised, most in the year after development | Lowered ("temporary brake", WMO) |
| Atlantic hurricanes | Fewer (formation hindered) | - |
| Peru fishing | Unfavourable (warm years) | Welcomed by fishermen; farmers face drought (cold years) |
| Coral reefs | Through 2023-24, every strong El Niño since 1998 coincided with a global bleaching event (NOAA, June 2026) | - |
Source: IPCC AR6 WGI Annex IV; WMO, 1 March 2023; WMO, 2 June 2026; NOAA PMEL 1994; NOAA NESDIS, 2 June 2026. "-" means the sources used give no tendency.
Sources
Each table and data figure names its source beneath it. The main documents are collected here, with a date where the source carries one. Figures not listed under image credits were drawn for this page from the sources stated in their source lines.
Main sources
| Topic | Source |
|---|---|
| Routes of teleconnection, regional tendencies, La Niña asymmetries, ENSO and global temperature, tropical cyclones, Indonesian fires | IPCC AR6 WGI Annex IV, section AIV.2.3 |
| El Niño's timing, its regional impacts, global temperature, hurricanes, climate change and El Niño | WMO, 2 June 2026 |
| The 2020-23 La Niña and its impacts | WMO, 1 March 2023 |
| ENSO winter impacts over North America | NOAA CPC, ENSO winter impacts over North America |
| Textbook | NCERT, Fundamentals of Physical Geography, Class XI, chapter 9 "Atmospheric Circulation and Weather Systems" (2026 reprint) |
| Peru's two kinds of bad year; impacts of the 1982-83 El Niño | NOAA PMEL, El Niño and Climate Prediction (Reports to the Nation, 1994) |
| The anchoveta fishery in the early 1970s | McPhaden, Zebiak and Glantz, Science 314, 1740-1745 (2006) |
| Anchoveta catch by year | FAO Fisheries Circular 920 |
| Global coral bleaching events | NOAA NESDIS, 2 June 2026 |
| Relative ONI (RONI) values | NOAA CPC RONI (file to ASO 2026) |
| The 2026 El Niño | NOAA CPC ENSO diagnostic discussion, El Niño Advisory of 12 November 2026; Bureau of Meteorology, 10 November 2026 |
Image credits
| Image | Credit and licence |
|---|---|
| All other figures | Drawn for this page from the sources given in their source lines. |