 BharatNotes
Part 4 of 10 of the El Niño and Climate Variability notes. The overview page has the quick revision and exam strategy for all ten parts.
Measuring and Forecasting ENSO
Saying "an El Niño is under way" needs a yardstick: a region of ocean to watch, an index to compute, a threshold to cross and an agency to declare it. This part explains the Niño regions, NOAA's Oceanic Niño Index and its new relative form, the Southern Oscillation Index and the Multivariate ENSO Index, the instruments that watch the Pacific, and how NOAA, the Bureau of Meteorology, WMO and IMD announce what the Pacific is doing. It ends with the full record of El Niño and La Niña episodes on NOAA's current index.
Why ENSO needs an index
El Niño is a change in the ocean and La Niña its opposite, while the Southern Oscillation is a see-saw of air pressure (part 6.3). Each can be measured, and each measure gives a slightly different answer. IPCC AR6 notes that the differences between events "imply that there is no commonly accepted list of events and associated magnitude" (IPCC AR6 WGI, Annex IV: Modes of Variability (2021)). It names the three most prominent indices: the average sea surface temperature (SST) anomaly over the Niño 3 region, the same over the Niño 3.4 region, and the Southern Oscillation Index (SOI), which is built from the air-pressure difference between Darwin and Tahiti.
The two kinds of index look at the same event from two sides. The SST indices measure the ocean's surface; the SOI measures the atmosphere's response. AR6 finds them closely linked: the correlation between Niño 3.4 SST and the SOI is about 0.89 over 1959-2019. The pressure record is also the longer one: AR6 notes that SOI data go back to 1876, while SST-based indices are much less certain before the 1950s.
Key idea
No single number captures ENSO. AR6 adds that "The variety in ENSO indices also explains the non-universality in the qualification of ENSO status delivered by meteorological agencies": two agencies can look at the same ocean and, for a while, call it differently. The section on who declares what, later in this part, shows how.
The Niño regions
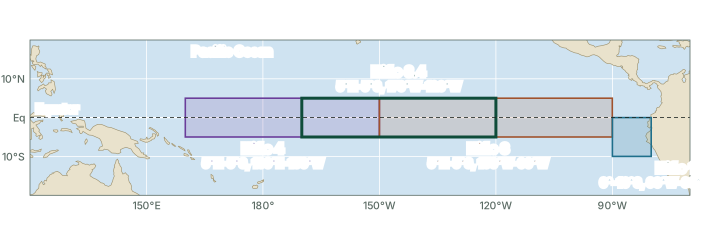
To turn "the eastern Pacific is warm" into a number, scientists average the SST anomaly over fixed boxes along the equator. The boxes are numbered from east to west, and Niño 3.4 overlaps its two neighbours (see the map below). The Bureau of Meteorology measures each anomaly against its 1991-2020 average and notes that the regions "are labelled Niño1, Niño2, Niño3, Niño3.4 and Niño4" (Bureau of Meteorology, ENSO monitoring page); NOAA combines the two coastal boxes into Niño 1+2.
The Niño regions
| Region | Box | Where and why it matters | Monthly SST anomaly, Oct 2026 (°C) |
|---|---|---|---|
| Niño 1+2 | 0°-10°S, 90°W-80°W | Coastal box off Ecuador and Peru, where the name El Niño began (part 6.3) | +5.25 |
| Niño 3 | 5°N-5°S, 150°W-90°W | Eastern equatorial Pacific | +4.16 |
| Niño 3.4 | 5°N-5°S, 170°W-120°W | East-central Pacific; the basis of NOAA's ONI and RONI | +3.25 |
| Niño 4 | 5°N-5°S, 160°E-150°W | Central and western Pacific | +1.20 |
Source: Boxes: NOAA PSL, list of climate indices. Anomalies: NOAA Climate Prediction Center, monthly Niño region SST indices (sstoi.indices), read for Oct 2026 (traditional anomalies, not relative); values as of November 2026; NOAA revises them when datasets change.
The table's last column shows how unevenly an El Niño can warm the ocean. In Oct 2026 the coastal box Niño 1+2 was +5.25 °C above normal and Niño 4 only +1.20 °C: that month the warming was concentrated in the east. The Bureau of Meteorology notes that the regions are used to monitor ENSO, "with Niño3 and Niño3.4 typically used to identify El Niño and La Niña". Niño 3.4 is the box on which NOAA builds its official index.
Don't confuse
- Niño 1+2 hugs the South American coast; Niño 3 covers the eastern equatorial Pacific; Niño 3.4 is NOAA's yardstick; Niño 4 lies furthest west, in the central and western Pacific.
- A region's monthly anomaly is not an index value. "Niño 3.4 was +3 °C in October" is one month in one box; the ONI or RONI is a 3-month mean (explained below).
The Oceanic Niño Index and the relative ONI
The classic ONI
NOAA's Oceanic Niño Index (ONI) is the 3-month running mean of the SST anomaly in Niño 3.4. Each value covers three overlapping months, written by their initials: DJF is December-January-February, JFM is January-February-March, and so on. Averaging over three months smooths out the noise of single months and weeks. NOAA counts El Niño conditions when the index is at or above +0.5 °C and La Niña conditions at or below −0.5 °C, and it counts an episode only when the threshold is met for five or more consecutive overlapping seasons (NOAA National Weather Service, Public Information Statement 26-05 (13 January 2026)).
Worked example: a 3-month mean
CPC's monthly file gives these Niño 3.4 SST anomalies: Aug 2026 +2.52 °C, Sep 2026 +2.84 °C, Oct 2026 +3.25 °C. What is their 3-month mean, the way the ONI is built?
- Add the three monthly anomalies: (+2.52) + (+2.84) + (+3.25) = +8.61 °C.
- Divide by three: +8.61 / 3 = +2.87 °C (computed).
- Check the threshold: +2.87 is far above +0.5 °C, so this season counts towards an El Niño. One season is not yet an episode: five overlapping seasons in a row are needed.
Answer: About +2.87 °C for ASO 2026 from the monthly file (computed). The published index uses a different SST analysis, so NOAA's values for ASO 2026 differ: +2.46 °C on the legacy ONI and +1.97 °C on the RONI. Always quote the published value and name the index.
The relative ONI (RONI), official from 1 February 2026
NOAA made a relative index its official ENSO index, effective 1 February 2026 (NOAA National Weather Service, Public Information Statement 26-05 (13 January 2026)). The relative anomaly "is computed by subtracting the average SST anomaly of the global tropics (20 degrees N to 20 degrees S) from the Niño 3.4 regional anomaly". After the subtraction, "the relative index is rescaled to match the amplitude of the traditional index", so the familiar thresholds of ±0.5 °C and the five-season rule still apply. The subtraction removes any warming that the whole tropical belt shares, so what remains is how much warmer or cooler Niño 3.4 is than the tropics around it.
The old index has not been switched off. NOAA states that "the legacy Niño 3.4 and Oceanic Niño Index files will continue to be updated for users that require that continuity". These notes call it the legacy ONI; its current files use NOAA's ERSSTv6 SST analysis. The chart below shows both.
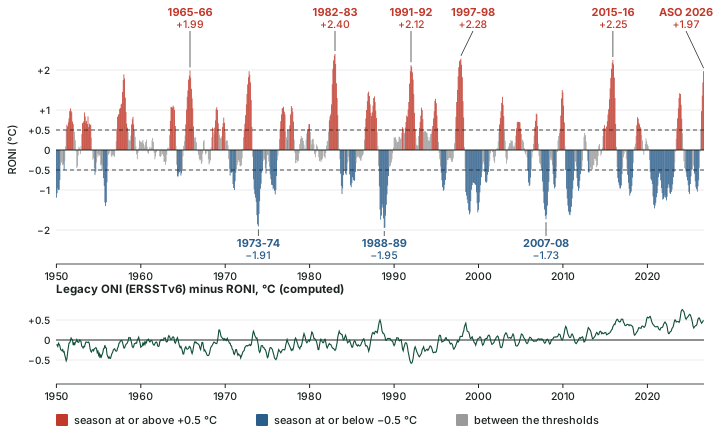
The lower panel of the chart above shows what the subtraction does. Over 1950-1979 the legacy ONI ran on average -0.15 °C from the RONI; over 2016-2025 it ran +0.41 °C from it (computed). In ASO 2026 the legacy ONI stood at +2.46 °C and the RONI at +1.97 °C, a gap of 0.49 °C (computed). In recent decades the tropics as a whole have run warm, so the legacy ONI reads higher. That is also why the same events can rank differently on the two indices: part 6.3 shows that 1982-83 is the highest El Niño on the RONI and 2015-16 the highest on the legacy ONI.
Remember
- ONI and RONI: 3-month running means of Niño 3.4; thresholds +0.5 °C and −0.5 °C; an episode needs five consecutive overlapping seasons.
- The RONI subtracts the mean anomaly of the whole tropical belt, 20°N-20°S, then rescales. It became NOAA's official index on 1 February 2026.
- Every index value moves a little when NOAA updates its datasets: values as of November 2026; NOAA revises them when datasets change.
Exam tip
Write "ONI" for the general idea, and name the RONI when quoting NOAA's values from February 2026 onwards, with the season: "RONI +1.97 °C (ASO 2026)", not "an El Niño of 2 °C".
The Southern Oscillation Index
NCERT's India: Physical Environment describes the Southern Oscillation through the pressure difference between Tahiti, in French Polynesia, and Port Darwin, in northern Australia (NCERT, India: Physical Environment, Class XI, ch. 4 "Climate" (2026-27 reprint)). The Bureau of Meteorology turns that difference into an index. "There are a few different methods for calculating the SOI", it notes, and the one it uses is the Troup SOI: the standardised anomaly of the mean sea-level pressure difference between Tahiti and Darwin, with a base period of 1933-1992 (Bureau of Meteorology, ENSO monitoring page).
SOI = 10 × (Pdiff − Pdiffav) / SD(Pdiff)
Pdiff is the average Tahiti pressure minus the average Darwin pressure for the month; Pdiffav is the long-term average of Pdiff for that month; SD(Pdiff) is its standard deviation. The factor of 10 is a convention that makes the index readable as a whole number: the SOI ranges from about −35 to about +35, and it is usually computed monthly.
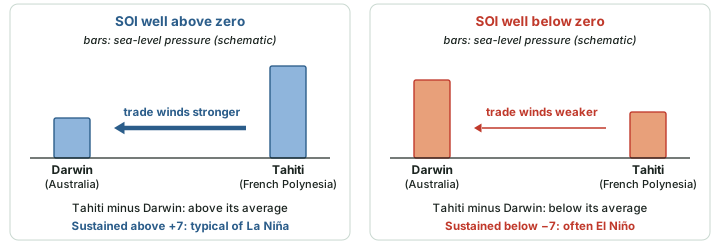
A falling SOI means Darwin's pressure is high relative to Tahiti's. The Bureau states that "Sustained negative values of the SOI lower than −7 often indicate El Niño episodes", usually accompanied by warming of the central and eastern tropical Pacific and weaker Pacific trade winds, while sustained positive values "greater than +7 are typical of a La Niña episode" (Bureau of Meteorology, Southern Oscillation Index page). In its update of 10 November 2026 the Bureau gave the 30-day SOI as −14.4 for the period to 8 November 2026: firmly on the El Niño side.
Why it happens
The SOI and Niño 3.4 move together because of the Bjerknes feedback (part 6.2). Warm water in the east shifts rising air and low pressure eastwards, so pressure rises at Darwin and falls at Tahiti; the weaker pressure gradient means weaker trade winds, which let still more warm water spread east. The SOI is the atmospheric half of the same coupled event, which is why the name ENSO joins the two.
The Multivariate ENSO Index
Because no single variable captures ENSO, NOAA's Physical Sciences Laboratory (PSL) publishes a Multivariate ENSO Index, now in its second version, the MEI.v2 (NOAA PSL, Multivariate ENSO Index Version 2 (MEI.v2)). It is bi-monthly: each value covers two months (December-January, January-February, and so on, twelve overlapping "seasons" a year). It combines five variables over the tropical Pacific, 30°S-30°N and 100°E-70°W: sea-level pressure, SST, the zonal (east-west) and meridional (north-south) components of the surface wind, and outgoing longwave radiation (OLR). The index is the leading pattern (the first empirical orthogonal function, EOF) of these five fields together, computed against a reference period of 1980-2018. The original MEI was introduced by Wolter and Timlin (1993). NOAA declares events on the RONI, not on the MEI.v2.
The main ENSO indices compared
| Index | What it measures | Averaging | Threshold and who uses it |
|---|---|---|---|
| RONI (relative ONI) | Niño 3.4 SST anomaly minus the 20°N-20°S tropical mean, rescaled | 3-month running mean | ±0.5 °C, five overlapping seasons; NOAA's official index from 1 February 2026 |
| Legacy ONI | Niño 3.4 SST anomaly against a fixed average (ERSSTv6 files) | 3-month running mean | ±0.5 °C; still updated by NOAA for continuity |
| Relative Niño 3 / Niño 3.4 (Bureau of Meteorology) | SST anomaly relative to the tropics, from September 2025 | Monthly | Sustained monthly values beyond ±0.8 °C typical of El Niño / La Niña |
| SOI (Troup) | Tahiti minus Darwin sea-level pressure, standardised; base 1933-1992 | Usually monthly | Sustained below −7 often El Niño; above +7 typical of La Niña (Bureau of Meteorology) |
| MEI.v2 | Leading combined EOF of SLP, SST, surface winds and OLR, 30°S-30°N, 100°E-70°W | Bi-monthly | No threshold used in these notes; published by NOAA PSL |
Source: NOAA National Weather Service, Public Information Statement 26-05 (13 January 2026); Bureau of Meteorology, ENSO monitoring page; Bureau of Meteorology, Southern Oscillation Index page; NOAA PSL, Multivariate ENSO Index Version 2 (MEI.v2).
Watching the ocean
An index is only as good as the measurements behind it, and most of the ocean is far from any coast. The Tropical Atmosphere Ocean (TAO) array of moored buoys across the equatorial Pacific was installed from 1985 and completed in 1994 (NOAA Climate.gov, "Landmark buoys across tropical Pacific Ocean get makeover"). In the western Pacific its partner is the TRITON (Triangle Trans-Ocean Buoy Network) array of the Japan Agency for Marine-Earth Science and Technology (JAMSTEC), and the combined array carries the name TAO/TRITON (NOAA PMEL, TAO/TRITON Collaboration).
Argo floats add the open ocean everywhere. "Argo deployments began in 2000" (Argo Program, Argo status). In WMO's words, the floats "typically measure ocean conditions from the surface to 2 000 metre depth every 10 days and transmit data in near real time via satellite" (WMO Bulletin 75(2), "How Ocean Observations Help Us Understand and Forecast El Niño" (2026)). Satellites add the sea surface itself, seen across the whole basin at once.
Why observations matter
Why the buoys matter (WMO, 2026): in forecast experiments, "ENSO prediction lead time decreases from about 4.5 months to 3.2 months" when ocean observations are withheld from the forecast system (WMO Bulletin 75(2), "How Ocean Observations Help Us Understand and Forecast El Niño" (2026)). Without the ocean data, the warning comes more than a month later.
Who declares what
NOAA: the ENSO Alert System
NOAA's Climate Prediction Center (CPC) issues an ENSO Diagnostic Discussion every month, and each one carries a status from its ENSO Alert System (NOAA CPC, ENSO Alert System definitions). A Watch is "Issued when conditions are favorable for the development of El Niño or La Niña conditions within the next six months". An Advisory is "Issued when El Niño or La Niña conditions are observed and expected to continue". A Final Advisory is "Issued after El Niño or La Niña conditions have ended". When none applies, the system is not active. Warm water alone does not make El Niño conditions: CPC's definition also requires that "An atmospheric response typically associated with El Niño is observed over the equatorial Pacific Ocean".
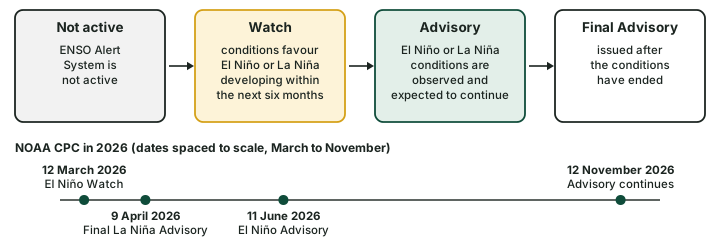
A Watch is a forecast; an Advisory is an observation plus a forecast that it will last. The Diagnostic Discussion of 12 November 2026 kept the status at "El Niño Advisory" and opened: "El Niño continues to strengthen, with a strong-to-very strong El Niño likely through January-March 2027 (remaining greater than a 79% chance)" (NOAA CPC, ENSO Diagnostic Discussion, 12 November 2026). The words "likely" and "chance" matter: CPC's forecasts are probabilities, issued for overlapping 3-month seasons, and part 6.3 explains why forecasts made in the northern spring are the least reliable.
Worked example: is it an episode yet?
CPC issued an El Niño Advisory on 11 June 2026. Using the RONI values below, decide whether the 2026 warming already counts as an El Niño episode on the RONI as of ASO 2026.
- List the latest RONI seasons: AMJ 2026 +0.49, MJJ 2026 +0.97, JJA 2026 +1.36, JAS 2026 +1.69, ASO 2026 +1.97 °C.
- AMJ 2026 is below +0.5 °C, so the warm run starts at MJJ 2026.
- Count the seasons at or above +0.5 °C: 4 (computed).
Answer: Not yet: 4 seasons, and an episode needs five. The Advisory reports conditions, which can be observed before the 3-month record confirms an episode. If the next 3-month value is also at or above +0.5 °C, the run becomes an episode starting in MJJ 2026.
The Bureau of Meteorology
Australia's Bureau of Meteorology made two changes that matter for anyone reading older notes. "From September 2025, the Bureau has used Relative Niño indices", and it cites "sustained monthly Relative Niño3 or Niño3.4 index values above +0.8 °C as typical of El Niño conditions", with values below −0.8 °C typical of La Niña (Bureau of Meteorology, ENSO monitoring page). And from December 2024 it stopped issuing its ENSO Outlook Watch and Alert statements, including the ENSO dial that many older notes still show. Its update of 10 November 2026 opened: "A strong to very strong El Niño is underway."
Don't confuse
- NOAA's threshold is ±0.5 °C on a 3-month mean; the Bureau's is ±0.8 °C on sustained monthly relative values; the SOI's is ±7. Each belongs to its own index.
- NOAA's Watch and Advisory are current; the Bureau's Watch, Alert and dial were retired from December 2024.
- A Watch or an outlook is a forecast; an Advisory reports conditions already observed; an episode in the RONI record is confirmed only after five seasons.
WMO, IMD and other centres
The World Meteorological Organization (WMO) issues El Niño/La Niña Updates. They "are based on a consensus of models from WMO Global Producing Centres, experts from National Meteorological and Hydrological Services and climate prediction centres around the world" (WMO, news release of 2 June 2026). The centres include NOAA CPC, the Bureau of Meteorology, ECMWF, Météo-France, India's IMD and IITM, the Japan Meteorological Agency (JMA), KMA, the UK Met Office and CMA. Part 6.10 follows WMO's 2026 Updates. India's IMD reports the state of the Pacific in its seasonal forecasts and press releases; on 31 October 2026 it wrote that "very strong El Nino conditions are prevailing over the Equatorial Pacific Ocean". NCERT notes that El Niño "is used in India for forecasting long range monsoon rainfall" (NCERT, India: Physical Environment, Class XI, ch. 4 "Climate" (2026-27 reprint)); part 6.9 explains how.
Who declares what (as of mid-November 2026)
| Agency | Index and threshold | Products | Latest statement (date) |
|---|---|---|---|
| NOAA CPC (USA) | RONI, ±0.5 °C; episodes need five overlapping seasons | Monthly Diagnostic Discussion; Watch, Advisory, Final Advisory | El Niño Advisory (12 November 2026) |
| Bureau of Meteorology (Australia) | Relative Niño3 / Niño3.4, sustained monthly ±0.8 °C; Troup SOI ±7 | ENSO updates; Watch, Alert and dial retired from December 2024 | "A strong to very strong El Niño is underway" (10 November 2026) |
| WMO | Consensus of Global Producing Centres | El Niño/La Niña Update | Updates through 2026 (part 6.10) |
| IMD (India) | Reports ENSO status; contributes to the WMO consensus | Seasonal forecasts and press releases | "very strong El Nino conditions are prevailing" (31 October 2026) |
Source: NOAA CPC, ENSO Alert System definitions; NOAA CPC, ENSO Diagnostic Discussion, 12 November 2026; Bureau of Meteorology, ENSO monitoring page and its update of 10 November 2026; WMO, news release of 2 June 2026; IMD, press release of 31 October 2026.
The record of episodes
Applying NOAA's rule to the whole RONI file, DJF 1949-50 to ASO 2026, gives 22 El Niño and 22 La Niña episodes (computed). The strength labels below use the thresholds in WMO's 2026 Bulletin: "strong" from 1.5 °C and "very strong" from 2.0 °C in Niño 3.4 (WMO Bulletin 75(2), "How Ocean Observations Help Us Understand and Forecast El Niño" (2026)), applied here to the RONI peak. No WMO threshold is used for weaker categories, so those episodes are marked "below strong". On the RONI, the very strong El Niño episodes are 1982-83, 1991-92, 1997-98 and 2015-16; the strong ones are 1957-58, 1965-66, 1972-73 and 2009-10. Among La Niña episodes, 1973-74, 1988-89, 1998-2000, 2007-08 and 2010-11 reached the strong line, and none the very strong line (computed). The median El Niño episode lasted 8.5 seasons and the median La Niña episode 8 (computed).
The label can change with the index. Taking the legacy ONI peak over the same seasons, the label differs for 5 episodes: 1991-92, 2023-24, 1955-56, 1973-74 and 1975-76 (computed). This is one more reason to name the index with every strength claim.
El Niño episodes on the RONI, 1950-2026
| Episode | First and last season | Seasons | RONI peak (season) | Label (RONI) | Legacy ONI peak, same seasons |
|---|---|---|---|---|---|
| 1951-52 | MAM 1951 to DJF 1951-52 | 10 | +1.04 (ASO 1951) | below strong | +1.03 |
| 1953-54 | JFM 1953 to JFM 1954 | 13 | +0.94 (AMJ 1953) | below strong | +0.78 |
| 1957-58 | FMA 1957 to MJJ 1958 | 16 | +1.89 (DJF 1957-58) | strong | +1.69 |
| 1963-64 | JJA 1963 to JFM 1964 | 8 | +1.11 (OND 1963) | below strong | +1.19 |
| 1965-66 | AMJ 1965 to MAM 1966 | 12 | +1.99 (OND 1965) | strong | +1.82 |
| 1968-69 | SON 1968 to FMA 1969 | 6 | +1.07 (DJF 1968-69) | below strong | +0.98 |
| 1972-73 | MAM 1972 to FMA 1973 | 12 | +1.97 (OND 1972) | strong | +1.84 |
| 1976-77 | JJA 1976 to JFM 1977 | 8 | +1.08 (NDJ 1976-77) | below strong | +0.84 |
| 1977-78 | ASO 1977 to JFM 1978 | 6 | +1.10 (OND 1977) | below strong | +0.84 |
| 1982-83 | AMJ 1982 to AMJ 1983 | 13 | +2.40 (DJF 1982-83) | very strong | +2.14 |
| 1986-1988 | JAS 1986 to NDJ 1987-88 | 17 | +1.46 (DJF 1986-87) | below strong | +1.49 |
| 1991-92 | AMJ 1991 to JJA 1992 | 15 | +2.12 (DJF 1991-92) | very strong | +1.54 |
| 1992-93 | DJF 1992-93 to MJJ 1993 | 6 | +1.06 (MAM 1993) | below strong | +0.76 |
| 1994-95 | JJA 1994 to FMA 1995 | 9 | +1.28 (NDJ 1994-95) | below strong | +0.97 |
| 1997-98 | AMJ 1997 to MAM 1998 | 12 | +2.28 (NDJ 1997-98) | very strong | +2.37 |
| 2002-03 | JJA 2002 to DJF 2002-03 | 7 | +1.33 (OND 2002) | below strong | +1.19 |
| 2004-05 | JJA 2004 to DJF 2004-05 | 7 | +0.71 (ASO 2004) | below strong | +0.71 |
| 2006-07 | ASO 2006 to DJF 2006-07 | 5 | +0.91 (OND 2006) | below strong | +0.88 |
| 2009-10 | ASO 2009 to FMA 2010 | 7 | +1.50 (NDJ 2009-10) | strong | +1.50 |
| 2015-16 | FMA 2015 to MAM 2016 | 14 | +2.25 (NDJ 2015-16) | very strong | +2.59 |
| 2018-19 | SON 2018 to MAM 2019 | 7 | +0.82 (OND 2018) | below strong | +1.05 |
| 2023-24 | JJA 2023 to JFM 2024 | 8 | +1.42 (OND 2023) | below strong | +1.99 |
Computed from NOAA Climate Prediction Center, Relative Oceanic Niño Index (RONI.ascii.txt) and NOAA Climate Prediction Center, legacy Oceanic Niño Index, ERSSTv6 (oni.ascii.txt): episodes are runs of five or more consecutive overlapping seasons at or beyond ±0.5 °C on the RONI; labels use the WMO Bulletin thresholds (strong 1.5 °C, very strong 2.0 °C) applied to the RONI peak; values as of November 2026; NOAA revises them when datasets change. The warm run at the end of the file (4 seasons from MJJ 2026) is not yet an episode and is not listed.
La Niña episodes on the RONI, 1950-2026
| Episode | First and last season | Seasons | RONI peak (season) | Label (RONI) | Legacy ONI peak, same seasons |
|---|---|---|---|---|---|
| 1949-50 | DJF 1949-50 to MJJ 1950 | 6 | -1.19 (DJF 1949-50) | below strong | -1.32 |
| 1955-56 | JAS 1955 to DJF 1955-56 | 6 | -1.40 (OND 1955) | below strong | -1.59 |
| 1964 | AMJ 1964 to OND 1964 | 7 | -0.66 (AMJ 1964) | below strong | -0.80 |
| 1970-71 | JAS 1970 to MAM 1971 | 9 | -1.00 (JFM 1971) | below strong | -1.36 |
| 1973-74 | AMJ 1973 to MJJ 1974 | 14 | -1.91 (NDJ 1973-74) | strong | -2.04 |
| 1975-76 | AMJ 1975 to JFM 1976 | 10 | -1.11 (NDJ 1975-76) | below strong | -1.58 |
| 1983-84 | ASO 1983 to JFM 1984 | 6 | -1.10 (OND 1983) | below strong | -0.96 |
| 1984-85 | SON 1984 to MJJ 1985 | 9 | -0.93 (NDJ 1984-85) | below strong | -1.06 |
| 1988-89 | MAM 1988 to AMJ 1989 | 14 | -1.95 (OND 1988) | strong | -1.85 |
| 1995-96 | JAS 1995 to FMA 1996 | 8 | -1.02 (OND 1995) | below strong | -1.05 |
| 1998-2000 | JJA 1998 to MJJ 2000 | 24 | -1.61 (NDJ 1998-99) | strong | -1.53 |
| 2000-01 | SON 2000 to FMA 2001 | 6 | -0.82 (NDJ 2000-01) | below strong | -0.78 |
| 2005-06 | OND 2005 to FMA 2006 | 5 | -0.90 (DJF 2005-06) | below strong | -0.86 |
| 2007-08 | JJA 2007 to AMJ 2008 | 11 | -1.73 (DJF 2007-08) | strong | -1.76 |
| 2008-09 | OND 2008 to FMA 2009 | 5 | -0.96 (DJF 2008-09) | below strong | -0.89 |
| 2010-11 | AMJ 2010 to AMJ 2011 | 13 | -1.63 (OND 2010) | strong | -1.57 |
| 2011-12 | ASO 2011 to FMA 2012 | 7 | -1.02 (OND 2011) | below strong | -1.02 |
| 2016-17 | JJA 2016 to DJF 2016-17 | 7 | -0.96 (SON 2016) | below strong | -0.51 |
| 2017-18 | ASO 2017 to MAM 2018 | 8 | -1.14 (NDJ 2017-18) | below strong | -0.76 |
| 2020-2023 | AMJ 2020 to FMA 2023 | 35 | -1.46 (OND 2020) | below strong | -1.11 |
| 2024-25 | JAS 2024 to MAM 2025 | 9 | -1.10 (DJF 2024-25) | below strong | -0.46 |
| 2025-26 | JAS 2025 to JFM 2026 | 7 | -1.04 (NDJ 2025-26) | below strong | -0.61 |
Computed from NOAA Climate Prediction Center, Relative Oceanic Niño Index (RONI.ascii.txt) and NOAA Climate Prediction Center, legacy Oceanic Niño Index, ERSSTv6 (oni.ascii.txt): episodes are runs of five or more consecutive overlapping seasons at or beyond ±0.5 °C on the RONI; labels use the WMO Bulletin thresholds (strong 1.5 °C, very strong 2.0 °C) applied to the RONI peak; values as of November 2026; NOAA revises them when datasets change. The first episode is already under way in the first season of the file, DJF 1949-50, so it may have begun before the record starts.
Summary
- ENSO is measured in the ocean (SST anomalies in the Niño regions) and in the atmosphere (the SOI); AR6 notes there is no commonly accepted list of events.
- Niño 1+2 is the coastal box, Niño 3 the east, Niño 3.4 the east-centre and NOAA's yardstick, Niño 4 the centre-west.
- The ONI is a 3-month running mean of Niño 3.4; ±0.5 °C, five overlapping seasons. From 1 February 2026 NOAA's official index is the relative ONI, which subtracts the tropical-mean anomaly; the legacy ONI is still updated.
- The Troup SOI (Tahiti minus Darwin) is the Bureau of Meteorology's atmospheric index: sustained below −7 often El Niño, above +7 typical of La Niña. The Bureau's relative Niño indices use ±0.8 °C.
- The MEI.v2 combines five variables over the tropical Pacific.
- TAO/TRITON moorings (TAO completed in 1994) and Argo floats (from 2000) watch the ocean below the surface.
Sources
Each table and data figure names its source beneath it. The main documents are collected here, with a date where the source carries one. Figures not listed under image credits were drawn for this page from the sources stated in their source lines.
Main sources
| Topic | Source |
|---|---|
| ENSO indices; no commonly accepted list of events; Niño region boxes | IPCC AR6 WGI, Annex IV: Modes of Variability (2021) |
| Niño region box coordinates | NOAA PSL, list of climate indices |
| Monthly Niño region anomalies | NOAA Climate Prediction Center, monthly Niño region SST indices (sstoi.indices), values as of November 2026 |
| The ONI and the relative ONI (RONI) | NOAA National Weather Service, Public Information Statement 26-05 (13 January 2026) |
| RONI and legacy ONI values; the record of episodes | NOAA Climate Prediction Center, Relative Oceanic Niño Index (RONI.ascii.txt); NOAA Climate Prediction Center, legacy Oceanic Niño Index, ERSSTv6 (oni.ascii.txt); values as of November 2026 |
| The Southern Oscillation (Tahiti and Port Darwin); ENSO and monsoon forecasting | NCERT, India: Physical Environment, Class XI, ch. 4 "Climate" (2026-27 reprint) |
| Niño regions, Relative Niño indices and the Troup SOI (Bureau of Meteorology) | Bureau of Meteorology, ENSO monitoring page; Bureau of Meteorology, Southern Oscillation Index page; Bureau of Meteorology update of 10 November 2026 |
| The Multivariate ENSO Index | NOAA PSL, Multivariate ENSO Index Version 2 (MEI.v2); Wolter and Timlin (1993) |
| The TAO and TAO/TRITON arrays | NOAA Climate.gov, "Landmark buoys across tropical Pacific Ocean get makeover"; NOAA PMEL, TAO/TRITON Collaboration |
| Argo floats | Argo Program, Argo status |
| Argo measurements; ocean observations and forecast lead time; strength thresholds | WMO Bulletin 75(2), "How Ocean Observations Help Us Understand and Forecast El Niño" (2026) |
| NOAA's ENSO Alert System | NOAA CPC, ENSO Alert System definitions; NOAA CPC, ENSO Diagnostic Discussion, 12 November 2026; CPC discussions of 12 March, 9 April and 11 June 2026 |
| WMO El Niño/La Niña Updates | WMO, news release of 2 June 2026 |
| IMD on the state of the Pacific | IMD, press release of 31 October 2026 |
Image credits
| Image | Credit and licence |
|---|---|
| All other figures | Drawn for this page from the sources given in their source lines. |