 BharatNotes
Part 2 of 10 of the El Niño and Climate Variability notes. The overview page has the quick revision and exam strategy for all ten parts.
The Tropical Pacific in its Normal State
El Niño and La Niña are departures from something. Before studying the departures, we need a clear picture of the ordinary tropical Pacific: trade winds blowing west, warm water heaped up near Indonesia, cold water rising off Peru, and a loop of air that rises over the warm side and sinks over the cool side. This part builds that picture, then shows the feedback that holds it together and can also tip it over.
Trade winds, the warm pool and the cold tongue
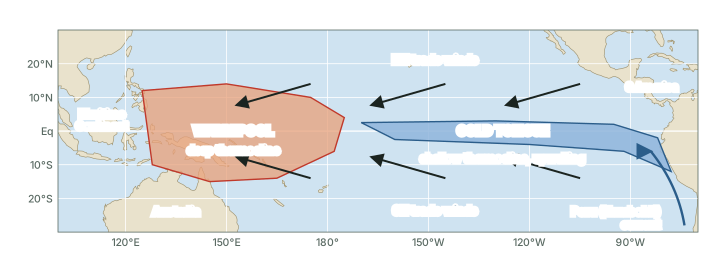
Across the tropical Pacific the trade winds blow from the east, north-easterly north of the equator and south-easterly south of it. Climate.gov puts the result simply: the trade winds at the equator blow "from east to west, pushing sea water towards the west side of most ocean basins. The ocean water warms the entire way" (NOAA Climate.gov, "The Walker Circulation: ENSO's atmospheric buddy"). The western Pacific therefore holds a large body of very warm surface water, known to scientists as the Pacific Warm Pool, while the eastern equatorial Pacific is cool for a tropical sea, a band of cold water called the cold tongue (see the map below).
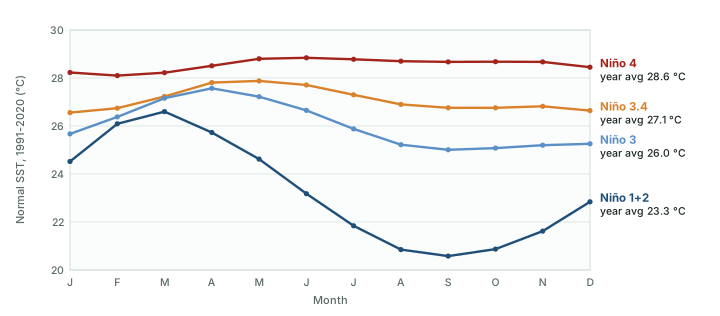
Real numbers show how large the contrast is. Averaged over 1991-2020, the Niño 4 region in the west-central Pacific is about 28.6 °C across the year, while the Niño 1+2 region off Ecuador and Peru averages about 23.3 °C (computed from NOAA CPC monthly data). The west also barely changes with the seasons, while the far east swings by several degrees between its warm season around March and its cool season around September (see the chart below).
Worked example: The east-west contrast
From the chart above, the 1991-2020 normal SST averaged over the year is 28.6 °C in Niño 4 and 23.3 °C in Niño 1+2. September is the coolest month in Niño 1+2 (20.6 °C); Niño 4 in September is 28.7 °C. How large is the contrast across the basin, on average and in September?
- Annual: 28.6 - 23.3 = 5.3 °C.
- September: 28.7 - 20.6 = 8.1 °C.
Answer: About 5 °C on average and about 8 °C in September (computed). This temperature difference is what drives the Walker circulation, explained later in this part.
A tilted ocean: sea level and the thermocline
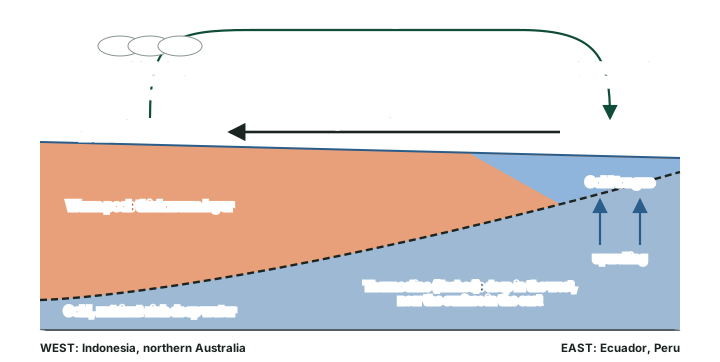
The trade winds do more than move surface water sideways; they tilt the whole upper ocean. NOAA's Pacific Marine Environmental Laboratory (PMEL) explains: "Because of the lower density of the warmer water, sea level is about two feet higher on the western side of the basin than on the eastern side when the winds are blowing at full strength" (NOAA PMEL, El Niño and Climate Prediction, Reports to the Nation on Our Changing Planet (1994)). Two feet is about 0.6 m (converted).
Below the surface lies the thermocline, which PMEL describes as the layer that "marks the boundary between warm surface water and cold, deep water". Without wind it "would be nearly flat; but the winds drag the surface water westward, raising the thermocline nearly all the way up to the surface in the east and depressing it in the west" (same source). So the thermocline slopes the opposite way to the sea surface: deep under the warm pool, shallow under the cold tongue (see the diagram below).
Key idea
- Normal state: sea surface higher in the west, thermocline deeper in the west, warm water in the west, cold water at the surface in the east.
- All four are held in place by the easterly trade winds. Weaken the winds and every one of them relaxes: that is El Niño (see El Niño and La Niña).
Don't confuse
- Sea surface vs thermocline: the sea surface is higher in the west; the thermocline is deeper in the west. They tilt in opposite directions.
- Thermocline vs the sea floor: the thermocline is a boundary inside the water between a warm upper layer and cold deep water, not the bottom of the ocean.
Upwelling and the Peru fishery
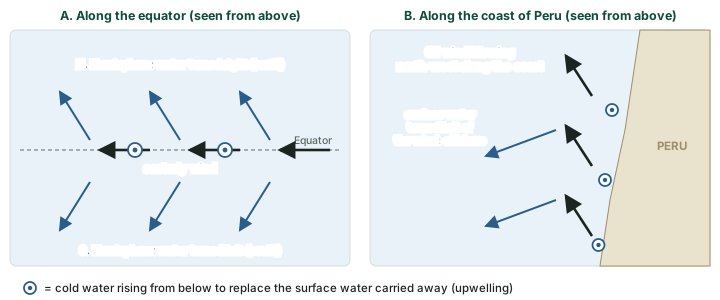
The cold tongue exists because cold water is pulled up from below, a process called upwelling. PMEL describes two kinds. Along the equator, easterly winds drag the surface water westward. "The Earth's rotation then deflects the resulting surface currents toward the right (northward) in the Northern Hemisphere and to the left (southward) in the Southern Hemisphere." Along the coasts of Peru and Ecuador, south-easterly winds do the same job, so the surface water is carried away from the coast. In both places, in PMEL's words: "Where the surface water moves away, colder, nutrient-rich water comes up from below to replace it, a phenomenon known as upwelling" (NOAA PMEL, El Niño and Climate Prediction, Reports to the Nation on Our Changing Planet (1994)). Both kinds are "concentrated in narrow regions" (same source; see the diagram below).
Upwelling is why these waters are so productive. PMEL explains that the cold water below the thermocline "is rich in chemical nutrients"; where it reaches the sunlit surface, tiny plants called phytoplankton bloom, and the food web builds on them. Without upwelling, in PMEL's words, "The surface waters above the thermocline would soon become devoid of nutrients". The shallow eastern thermocline matters here: upwelling can only bring up cold, nutrient-rich water if that water lies close enough to the surface. NCERT's India: Physical Environment (Class XI, chapter 4, current reprint) names the cold current off this coast the "cold Peruvian current or Humbolt current" (spelt so in NCERT); it adds to the cool, rich coastal water. The part on El Niño and La Niña shows what happens to the fishery when the thermocline sinks during El Niño.
Remember
- Equatorial upwelling: easterly winds + Earth's rotation push water north and south away from the equator.
- Coastal upwelling: south-easterly winds along Peru and Ecuador carry surface water offshore.
- Upwelling brings up cold, nutrient-rich water, so plankton and fish thrive.
Walker's Southern Oscillation and the Walker circulation
The atmospheric half of the story was found first, in India. Climate.gov records that while working in India in the early 1900s, Gilbert Walker observed "the swaying of [atmospheric] pressure on a big scale backwards and forwards between the Pacific Ocean and Indian Ocean" (NOAA Climate.gov, "The rise of El Niño and La Niña"). This pressure seesaw became known as the Southern Oscillation; IPCC AR6 records that it "was named in 1924". When pressure is unusually high on one side of the Pacific, it tends to be low on the other. The part on measuring and forecasting ENSO shows how the Tahiti-Darwin pressure difference turns this into an index.
The circulation that links the two sides was named by the meteorologist J. Bjerknes in 1969: "Hereafter, in the present article that circulation will be referred to as the 'Walker Circulation' since it can be shown to be an important part of the mechanism of Walker's 'Southern Oscillation.'" (Bjerknes, J. (1969), "Atmospheric teleconnections from the equatorial Pacific", Monthly Weather Review 97(3), 163-172). Climate.gov describes the loop: "The lower part of the loop flows east to west across much of the tropics near the surface; the upper part flows west to east at higher altitudes. Rising air in the west and sinking air in the east connect the flow in one big, continuous loop" (NOAA Climate.gov, "The Walker Circulation: ENSO's atmospheric buddy").
Above the warm pool, warm moist air rises, builds deep clouds and gives heavy rain; above the cooler water in the east, in Climate.gov's words, "air dries and settles near the surface". The strongest upward branch sits over the Maritime Continent, north of Australia, with weaker rising branches over eastern Africa and northern South America (see the diagram below). Climate.gov calls the Walker circulation "a thermally (fancy word for temperature) direct circulation that relies on temperature differences to drive the rising and sinking branches" (same source). Surface pressure is lower where air rises and higher where it sinks, and the trade winds, in Climate.gov's phrase, "normally blow from areas of sinking motion to areas of rising motion" (NOAA Climate.gov, "The rise of El Niño and La Niña").
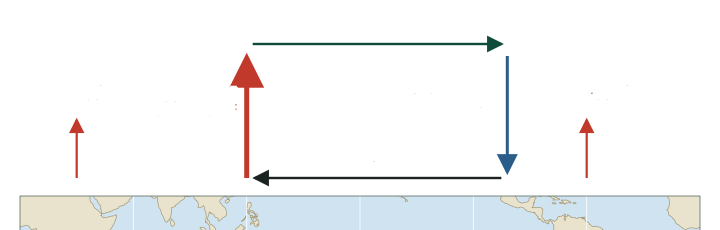
The Walker circulation runs east-west along the equator. It should not be confused with the Hadley cell, which runs north-south: air rises near the equator, flows towards the poles aloft and sinks in the subtropics, feeding the trade winds. The BharatNotes page on general circulation and jet streams explains the Hadley cell and the three-cell model in full.
Don't confuse
- Walker circulation: east-west, along the equator; driven by the east-west difference in sea temperature; named by Bjerknes (1969) after Walker.
- Hadley cell: north-south, from the equator to the subtropics, in each hemisphere.
- Southern Oscillation: the pressure seesaw Walker found (named 1924); the Walker circulation is the airflow that goes with it.
The Bjerknes feedback
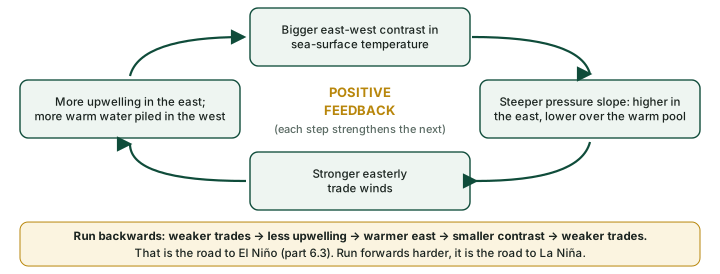
Bjerknes's key insight was that the ocean and the air are not separate. Climate.gov states it plainly: "The Bjerknes feedback is a positive feedback between tropical Pacific surface wind and ocean temperature" (NOAA Climate.gov, "The rise of El Niño and La Niña"). In his 1969 paper Bjerknes traced the chain. A steeper pressure slope at the base of the Walker circulation goes with stronger equatorial easterlies, and so with more upwelling and a sharper contrast in surface temperature between the eastern and western Pacific. "This chain reaction shows that an intensifying Walker Circulation also provides for an increase of the east-west temperature contrast that is the cause of the Walker Circulation in the first place" (Bjerknes, J. (1969), "Atmospheric teleconnections from the equatorial Pacific", Monthly Weather Review 97(3), 163-172).
Climate.gov adds the western half of the loop: the same winds "transport surface water, heated by the sun along the way, to the western Pacific, which literally piles up warmer water around Indonesia", and these warmer waters "help the air to rise even more over Indonesia" (NOAA Climate.gov, "The rise of El Niño and La Niña"). Bjerknes also saw that the loop runs in reverse: "A decrease of the equatorial easterlies weakens the equatorial upwelling, thereby the eastern equatorial Pacific becomes warmer" and the circulation slows (see the diagram below).
Why it happens
A positive feedback amplifies whatever starts it. A small weakening of the trade winds warms the east a little, which weakens the trades further: the feedback grows a small wobble into El Niño. A small strengthening does the opposite and grows La Niña. What stops the growth, and turns one phase into the other, is a slower negative feedback in the ocean, explained in El Niño and La Niña.
Exam tip
- In answers, name the loop: "trade winds - upwelling - SST gradient - pressure gradient - trade winds", and call it the Bjerknes feedback.
- Link it to India in one line: the rising branch of the Walker circulation over the western Pacific and Maritime Continent shifts during El Niño, and the part on ENSO, the IOD and the Indian monsoon traces what that does to the monsoon.
Summary
- Easterly trade winds push warm surface water west, building the warm pool near Indonesia and leaving a cold tongue in the east.
- The sea surface stands higher in the west; the thermocline is deep in the west and shallow in the east.
- Equatorial and coastal upwelling bring cold, nutrient-rich water up off Peru and Ecuador, feeding a rich fishery.
- Air rises over the warm pool and sinks over the cool east: the Walker circulation, named by Bjerknes in 1969 after Walker's Southern Oscillation.
- The Bjerknes feedback links winds and sea temperature in a positive feedback that can strengthen or weaken the whole system.
The western and eastern equatorial Pacific in the normal state
| Feature | West (warm pool, near Indonesia) | East (cold tongue, off Ecuador and Peru) |
|---|---|---|
| Sea-surface temperature | Warm all year: Niño 4 about 28.6 °C (1991-2020 average) | Cooler: Niño 1+2 about 23.3 °C, with a large seasonal swing |
| Sea level | Higher (about two feet when winds are at full strength) | Lower |
| Thermocline | Deep | Near the surface |
| Upwelling | Weak | Strong, along the equator and the coast |
| Air motion | Rising; the strongest Walker branch | Sinking, dry |
| Surface pressure | Lower | Higher |
| Rainfall | Heavy | Low |
| Nutrients and fish | Fewer nutrients at the surface | Nutrient-rich; productive fishery |
Source: NOAA PMEL, El Niño and Climate Prediction, Reports to the Nation on Our Changing Planet (1994); NOAA Climate.gov, "The Walker Circulation: ENSO's atmospheric buddy"; NOAA Climate.gov, "The rise of El Niño and La Niña"; SST computed from NOAA CPC sstoi.indices (as of November 2026).
Sources
Each table and data figure names its source beneath it. The main documents are collected here, with a date where the source carries one. Figures not listed under image credits were drawn for this page from the sources stated in their source lines.
Main sources
| Topic | Source |
|---|---|
| Trade winds, the warm pool, the Walker loop | NOAA Climate.gov, "The Walker Circulation: ENSO's atmospheric buddy" |
| Sea level, the thermocline, upwelling and nutrients | NOAA PMEL, El Niño and Climate Prediction, Reports to the Nation on Our Changing Planet (1994) |
| Normal SST of the Niño regions, 1991-2020 | NOAA Climate Prediction Center, monthly Niño region SST indices (sstoi.indices), values as of November 2026 |
| Walker's Southern Oscillation; the Bjerknes feedback | NOAA Climate.gov, "The rise of El Niño and La Niña" |
| Naming of the Southern Oscillation (1924) | IPCC AR6 WGI, Annex IV: Modes of Variability (2021) |
| Naming of the Walker circulation; the feedback chain | Bjerknes, J. (1969), "Atmospheric teleconnections from the equatorial Pacific", Monthly Weather Review 97(3), 163-172 |
| The Peruvian (Humbolt) current | India: Physical Environment, NCERT Class XI, chapter 4 (current reprint) |
Image credits
| Image | Credit and licence |
|---|---|
| All other figures | Drawn for this page from the sources given in their source lines. |