 BharatNotes
Part 4 of 11 of the Atmosphere and Climatology notes. The overview page has the quick revision and exam strategy for all eleven parts.
Atmospheric Pressure and Winds
Air has weight, and that weight presses on everything beneath it. Differences in this pressure from place to place set the air moving: wind is air moving from higher towards lower pressure. This part explains how pressure is measured and mapped, how it changes with height, where the world's high and low pressure belts lie, and the forces that decide the speed and direction of the wind.
What air pressure is
NCERT defines it simply: "The weight of a column of air contained in a unit area from the mean sea level to the top of the atmosphere" is the atmospheric pressure. The more air there is above a place, the greater the weight pressing down on it, so pressure is highest at sea level and falls with height.
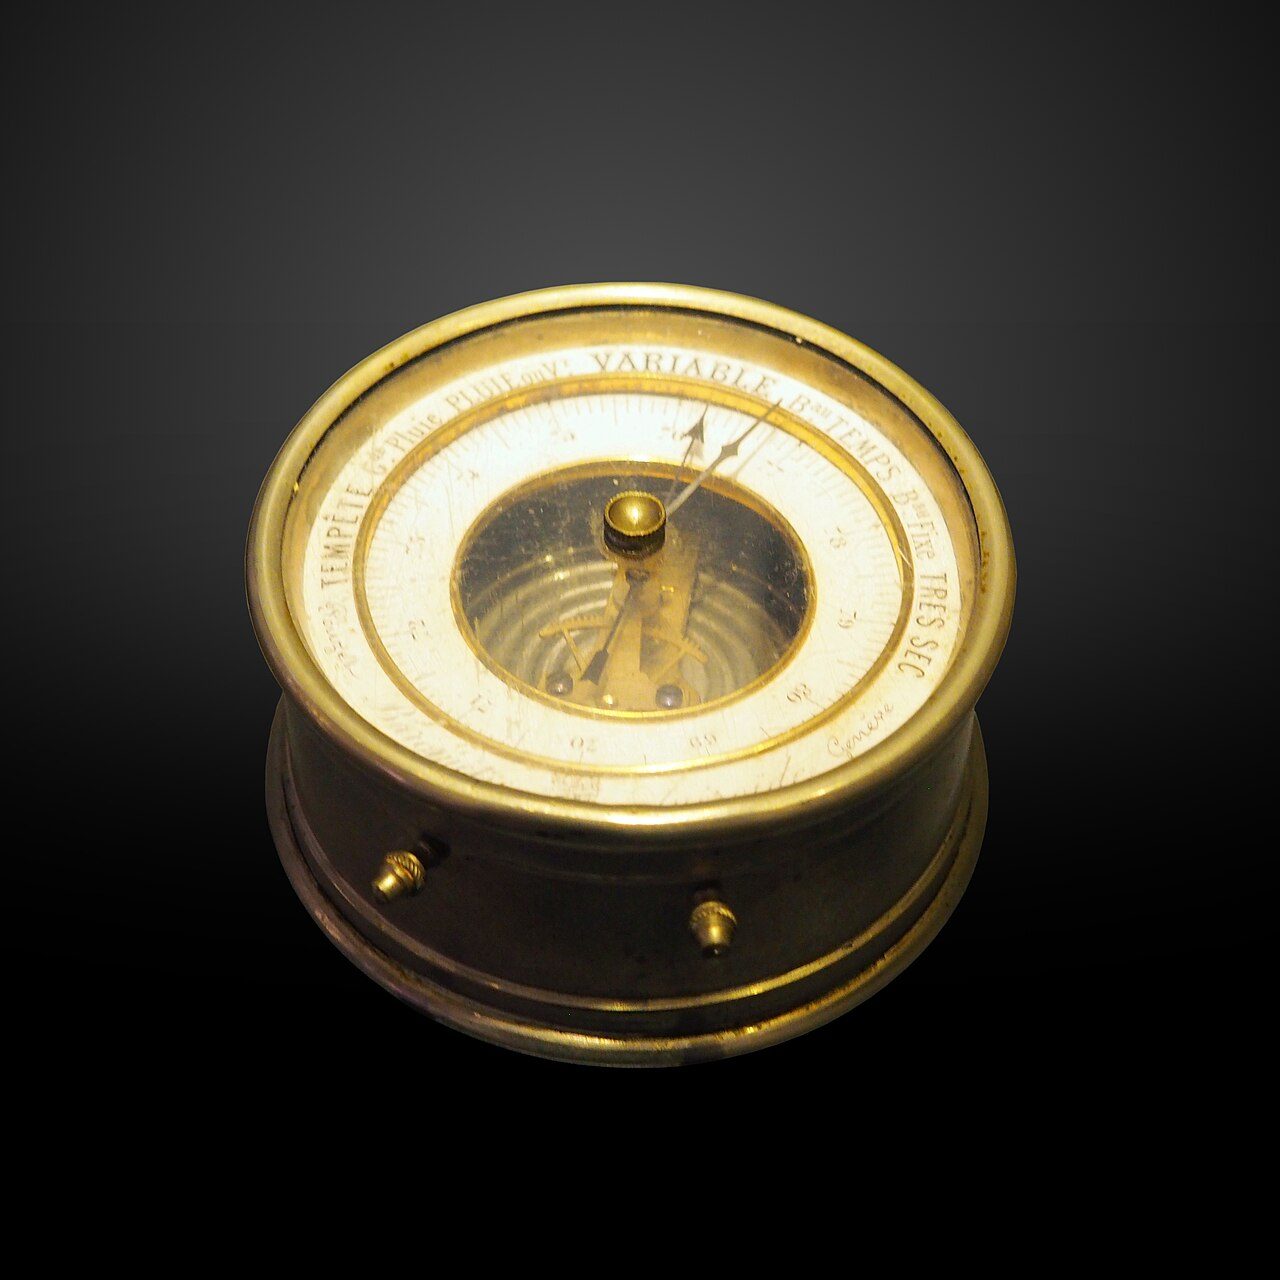
Pressure is expressed in millibars (mb). Weather maps also use the hectopascal (hPa), and one hectopascal equals one millibar (NWS glossary, "hectopascal"). NCERT gives the average pressure at sea level as "1,013.2 milibar" and names the two instruments that measure it: the mercury barometer (NWS glossary, "mercury barometer") and the aneroid barometer. The figure used as the standard differs slightly from source to source, because each describes something different.
Air pressure at sea level: the figures and their basis
| Figure | Value | Basis |
|---|---|---|
| NCERT, chapter 9 text | 1,013.2 mb | average sea-level pressure |
| NCERT, Table 9.1 | 1,013.25 mb | sea-level value of the standard pressure table |
| NIST | 101,325 Pa = 1,013.25 hPa | the defined standard atmosphere; hPa computed by dividing pascals by 100 |
| NASA Earth Fact Sheet | about 1,014 mb | mean surface pressure of the Earth |
Source: NCERT, Fundamentals of Physical Geography, Class XI, ch 9 "Atmospheric Circulation and Weather Systems" (Reprint 2026-27); NIST; NASA Earth Fact Sheet.
Remember
1 hPa = 1 mb. Standard sea-level pressure is 1,013.25 hPa; NCERT's text rounds it to 1,013.2 mb.
Pressure and height
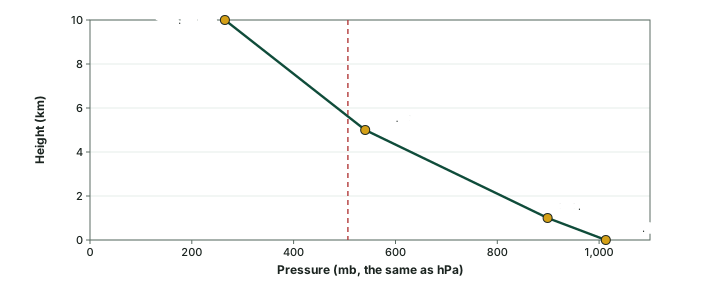
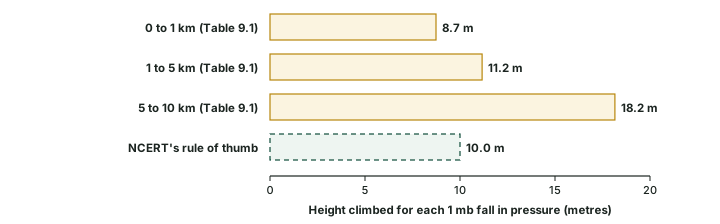
In the lower atmosphere pressure falls rapidly with height. NCERT puts the rate at "about 1 mb for each 10 m increase in elevation. It does not always decrease at the same rate". NCERT's Table 9.1 shows why the rule is only a rule of thumb: the fall is fastest near the ground and slows higher up.
Pressure and temperature at selected heights (NCERT Table 9.1), with the rate of fall
| Height | Pressure (mb) | Temperature (°C) | Fall from the level below (computed) | Height per 1 mb fall (computed) |
|---|---|---|---|---|
| Sea level | 1,013.25 | 15.2 | starting value | starting value |
| 1 km | 898.76 | 8.7 | 114.49 mb over 1,000 m | 8.7 m |
| 5 km | 540.48 | -17.3 | 358.28 mb over 4,000 m | 11.2 m |
| 10 km | 265.00 | -49.7 | 275.48 mb over 5,000 m | 18.2 m |
Source: NCERT, Fundamentals of Physical Geography, Class XI, ch 9 "Atmospheric Circulation and Weather Systems" (Reprint 2026-27), Table 9.1. Computed: fall = difference between levels; height per mb = layer depth ÷ fall.
Worked example: Checking the rule of thumb
Sea-level pressure is 1,013.25 mb. Use NCERT's rule (1 mb for each 10 m) to estimate the pressure at 1 km, and compare the estimate with NCERT's Table 9.1.
- 1,000 m ÷ 10 m per mb = a fall of 100 mb.
- Estimate: 1,013.25 − 100 = 913.25 mb.
- NCERT's Table 9.1 gives 898.76 mb: a fall of 114.49 mb, or 1 mb for every 8.7 m (1,000 ÷ 114.49).
- The rule is close near the ground; higher up each millibar takes far more height.
Answer: about 913 mb by the rule, against 898.76 mb in the table.
The fall of pressure with height creates a strong upward push, the vertical pressure gradient force, much larger than the horizontal one. Yet the air does not rush upward, because gravity pulls it down with an almost equal force. NCERT: "Hence, we do not experience strong upward winds." Winds are therefore mostly horizontal, driven by the much smaller differences in pressure from place to place.
Pressure on the map: isobars
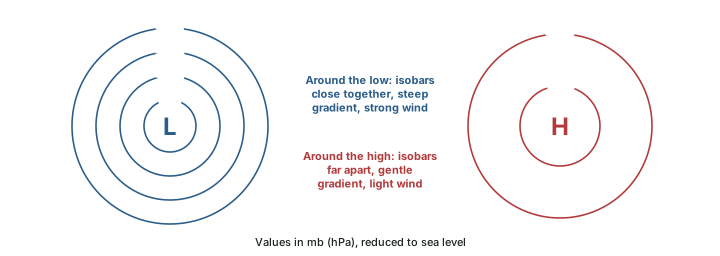
Pressure is shown on weather maps by isobars, lines joining places of equal pressure (NWS glossary, "isobar"). Because pressure falls so quickly with height, a station on a hill always reads lower than one on the coast. To compare places fairly, each reading is first reduced to its value at sea level (NWS glossary, "sea level pressure"; NCERT). A low-pressure system is enclosed by isobars with the lowest pressure at the centre; a high-pressure system has the highest pressure at the centre (NCERT).
The change of pressure over a distance is the pressure gradient. It is strong where the isobars are close together and weak where they are far apart (NCERT). The force it produces, the pressure gradient force, acts from higher towards lower pressure (NWS glossary, "pressure gradient force"), so the closer the isobars, the stronger the wind.
Exam tip
Read a weather map by the spacing of its isobars: tightly packed isobars mark the windiest places on the map.
The world pressure belts
NCERT describes the world distribution of sea-level pressure as a set of belts. Near the Equator lies the equatorial low. Along about 30° N and 30° S lie the subtropical highs. Further poleward, along about 60° N and 60° S, lie the sub-polar lows, and over the poles the polar highs. The trade winds of the two hemispheres meet in the equatorial low, in the Intertropical Convergence Zone (NWS glossary, "intertropical convergence zone"); the part on the general circulation explains this zone and the winds that blow between the belts.
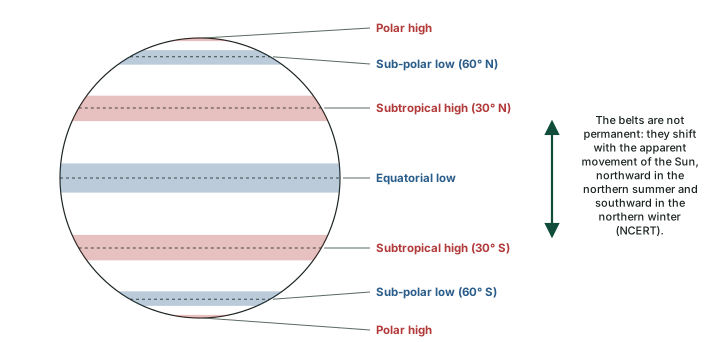
NCERT stresses that the belts "oscillate with the apparent movement of the sun": in the Northern Hemisphere they move southwards in winter and northwards in summer. The positions are averages, too. The Met Office's account of the three-cell circulation puts the boundaries between the cells at about 30° to 40° and 60° to 70° of latitude (Met Office); NCERT rounds them to 30° and 60°.
The forces that move the air
Three horizontal forces act on moving air (NCERT): the pressure gradient force, which starts it moving; friction, which slows it; and the Coriolis force, which turns it. Gravity acts downward and, as the section on pressure and height showed, balances the vertical push of pressure.
Friction
Friction with the ground slows the wind. NCERT: it "is greatest at the surface and its influence generally extends upto an elevation of 1 - 3 km. Over the sea surface the friction is minimal." The US National Weather Service glossary defines the planetary boundary layer as the lowest kilometre or so of the air, in which friction with the surface affects the wind speed (NWS glossary, "planetary boundary layer"). NCERT gives a range of heights; the NWS glossary gives one typical depth.
The Coriolis force
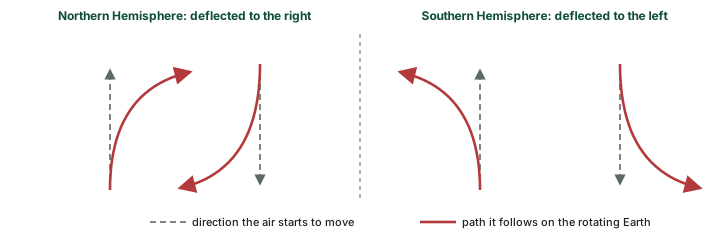
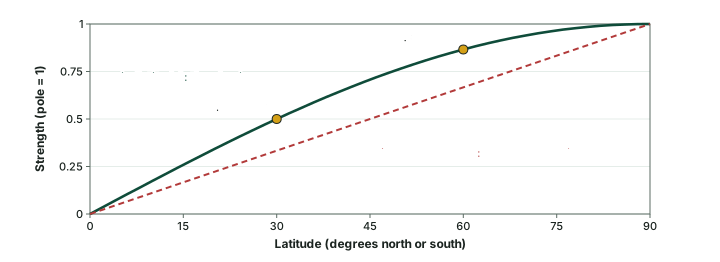
The Earth rotates beneath the moving air, and the air's path is deflected: to the right in the Northern Hemisphere and to the left in the Southern (NCERT). The deflecting force is the Coriolis force. NCERT adds that it "acts perpendicular to the pressure gradient force" and that the "deflection is more when the wind velocity is high". It is greatest at the poles and absent at the Equator (NCERT).
NCERT says the force is "directly proportional to the angle of latitude". The physics is slightly different: the strength follows the sine of the latitude. The Coriolis parameter is f = 2Ω sin φ, where Ω is the Earth's rate of rotation and φ the latitude (Price, MIT OpenCourseWare). At 30° the sine is 0.50, so the force is already half its polar value, not a third as a straight proportion to the angle would give (computed).
Don't confuse
NCERT names the force "after the French physicist who described it in 1844". The MacTutor History of Mathematics archive dates Coriolis's paper to 1835 and his death to 1843 (MacTutor), so 1844 cannot be the year he described it. In the exam hall, know NCERT's year and the reason it is doubtful.
Geostrophic and gradient winds; Buys Ballot's law
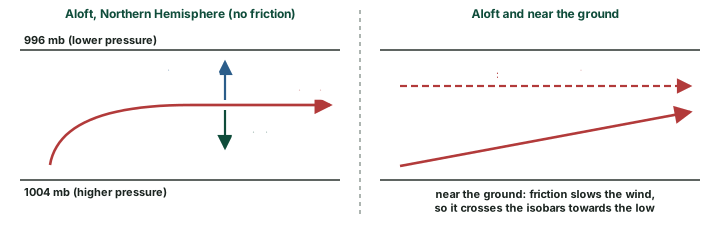
Picture air at rest between two straight isobars, a few kilometres above the ground. The pressure gradient force sets it moving towards the low. As it gains speed the Coriolis force grows and turns it, until the two forces are equal and opposite. NCERT: "When isobars are straight and when there is no friction, the pressure gradient force is balanced by the Coriolis force and the resultant wind blows parallel to the isobar." This is the geostrophic wind.
The winds in the upper atmosphere, 2 to 3 km above the surface, are free from the friction of the ground and are controlled by the pressure gradient and the Coriolis force (NCERT), so they come close to geostrophic. Near the ground, two of NCERT's statements combine: friction slows the surface wind, and a slower wind is deflected less. The Coriolis force can then no longer balance the pressure gradient force, so the wind blows at an angle across the isobars towards lower pressure. The balance also fails near the Equator, where the Coriolis force is weak: geostrophic balance is a poor guide within about 10° of the Equator (Price, MIT OpenCourseWare).
NCERT does not discuss the gradient wind; the explanation here is this page's own. Isobars are seldom straight. Around a low or a high the air follows a curved path, and anything moving on a curve needs a net force towards the centre of the curve: the centripetal acceleration. Around a low, the inward pressure gradient force is slightly larger than the outward Coriolis force, and the difference turns the air round the centre. Around a high, the inward Coriolis force is larger than the outward pressure gradient force. The wind that blows parallel to curved isobars under this three-way balance is the gradient wind.
Buys Ballot's law turns these rules into a quick test. In the Northern Hemisphere, stand with your back to the wind and low pressure is on your left; in the Southern Hemisphere it is on your right. It is the same balance as the geostrophic wind: in the Northern Hemisphere the higher pressure lies to the right of the wind, in the Southern Hemisphere to the left (Price, MIT OpenCourseWare).
Key idea
The pressure gradient force starts the wind; the Coriolis force turns it; friction slows it near the ground. Aloft the wind blows along the isobars; near the ground it crosses them towards the low.
Cyclonic and anticyclonic circulation
The wind circulation around a low is called cyclonic and around a high anticyclonic (NCERT; NWS glossary, "cyclone"). Because the deflection changes sides at the Equator, so does the sense of rotation. Around a low the winds blow anticlockwise in the Northern Hemisphere and clockwise in the Southern; around a high they blow clockwise in the north and anticlockwise in the south (NCERT Table 9.2).
Pressure systems and their winds (NCERT Table 9.2, with the vertical motion)
| Pressure system | Pressure at the centre | Northern Hemisphere | Southern Hemisphere | Air at the surface |
|---|---|---|---|---|
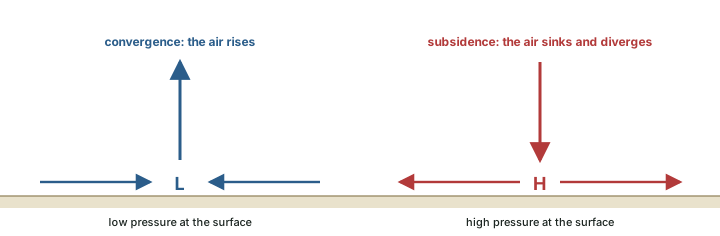
| Cyclone | low | anticlockwise | clockwise | converges and rises |
| Anticyclone | high | clockwise | anticlockwise | sinks and diverges |
Source: NCERT, Fundamentals of Physical Geography, Class XI, ch 9 "Atmospheric Circulation and Weather Systems" (Reprint 2026-27)
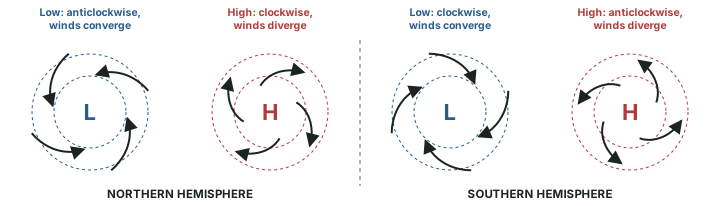
Winds spiral in towards a low, so the air there converges and rises. Over a high, air subsides from above and diverges at the surface (NCERT). Besides convergence, NCERT lists eddies, convection currents, orographic uplift and uplift along fronts as causes of rising air, which is "essential for the formation of clouds" (NCERT); the part on water in the atmosphere explains how rising air cools and condenses.
At the Equator the Coriolis force is zero, and the wind blows straight across the isobars into a low. The low is filled in instead of deepening (NCERT): "That is the reason why tropical cyclones are not formed near the equator." The part on tropical cyclones takes up the tropical cyclone itself.
Why it happens
A cyclone needs the Coriolis force to set its winds turning round the centre. Without it, air pours straight into the low and fills it, so no storm can organise near the Equator.
Pressure records
The World Meteorological Organization keeps the official pressure records with its temperature records (WMO, table as of 31 July 2025). Both high-pressure records were set in late December, in the northern winter; the lowest was measured in the eye of a typhoon.
World pressure records (WMO)
| Record | Value | Place | Date |
|---|---|---|---|
| Highest sea-level pressure, station below 750 m | 1,083.8 hPa | Agata, Russia | 31 December 1968 |
| Highest sea-level pressure, station above 750 m | 1,089.1 hPa | Tosontsengel, Mongolia | 30 December 2004 |
| Lowest sea-level pressure | 870 hPa | eye of Typhoon Tip | 12 October 1979 |
Source: WMO, "Records of Weather and Climate Extremes", as of 31 July 2025.
Summary
- Air pressure is the weight of the air column above a unit area (NCERT). Standard sea-level pressure is 1,013.25 hPa; 1 hPa = 1 mb.
- Pressure falls with height, fastest near the ground: about 1 mb per 10 m by NCERT's rule, 8.7 m per mb in the lowest kilometre of NCERT's Table 9.1 (computed).
- Isobars join places of equal sea-level pressure; close isobars mean strong winds.
- The belts: equatorial low, subtropical highs (about 30°), sub-polar lows (about 60°), polar highs. They shift with the apparent movement of the Sun.
- The pressure gradient force starts the wind, the Coriolis force turns it (right in the north, left in the south, zero at the Equator), and friction slows it below 1 to 3 km.
- Aloft the wind is geostrophic, parallel to straight isobars; around curved isobars it is the gradient wind.
- Lows: anticlockwise in the north, clockwise in the south, converging and rising air. Highs: the reverse, with sinking and diverging air.
The forces on moving air compared
| Force | Direction | Depends on | Effect on the wind |
|---|---|---|---|
| Pressure gradient force | from high towards low pressure, across the isobars | spacing of the isobars | starts the air moving |
| Coriolis force | at right angles to the motion: right in the north, left in the south | latitude (zero at the Equator, greatest at the poles) and wind speed | turns the wind |
| Friction | against the motion | the surface: greatest at the ground, least over the sea; felt up to 1 to 3 km (NCERT) | slows the wind; makes it cross the isobars towards the low |
| Centripetal acceleration | towards the centre of a curved path | curvature of the isobars and wind speed | keeps the gradient wind on its curved path |
| Gravity | downward | always present | balances the vertical pressure gradient force |
Source: NCERT, Fundamentals of Physical Geography, Class XI, ch 9 "Atmospheric Circulation and Weather Systems" (Reprint 2026-27); NWS glossary, "pressure gradient force"; NWS glossary, "coriolis force".
Sources
Each table and data figure names its source beneath it. The main documents are collected here, with a date where the source carries one. Figures not listed under image credits were drawn for this page from the sources stated in their source lines.
Main sources
| Topic | Source |
|---|---|
| Textbook | NCERT, Fundamentals of Physical Geography, Class XI, ch 9 "Atmospheric Circulation and Weather Systems" (Reprint 2026-27) |
| Units, barometers, isobars, sea-level pressure, forces, boundary layer, cyclones, ITCZ | US National Weather Service glossary: hectopascal, mercury barometer, aneroid barometer, isobar, sea level pressure, pressure gradient force, planetary boundary layer, coriolis force, cyclone, intertropical convergence zone |
| Standard atmosphere (101,325 Pa) | NIST |
| Mean surface pressure of the Earth | NASA Earth Fact Sheet |
| Edges of the three circulation cells | Met Office, account of the three-cell circulation |
| Coriolis parameter f = 2Ω sin φ | Price, MIT OpenCourseWare |
| Coriolis's paper (1835) and death (1843) | MacTutor History of Mathematics archive |
| World pressure records | World Meteorological Organization, table as of 31 July 2025 |
Image credits
| Image | Credit and licence |
|---|---|
| Aneroid barometer | Rama. CC BY-SA 3.0 fr, via Wikimedia Commons. File page |
| All other figures | Drawn for this page from the sources given in their source lines. |