 BharatNotes
Part 9 of 11 of the Atmosphere and Climatology notes. The overview page has the quick revision and exam strategy for all eleven parts.
Water in the Atmosphere
Every cloud, fog, dewdrop, raindrop and hailstone starts as invisible water vapour. This part follows that vapour: how its amount is measured, how air cools until the vapour condenses, why some air rises freely and some refuses to, how cloud droplets grow heavy enough to fall, and where on Earth the most and least rain falls, by the World Meteorological Organization’s records.
Water vapour and humidity
Water vapour is the one gas in the air whose amount swings widely. NCERT puts its share at anything from zero to four per cent: it "varies from zero to four per cent by volume of the atmosphere" (NCERT, ch 10). The composition and structure part places it among the variable gases. Small as the share is, every form of condensation and precipitation in this part comes out of it.
"Water vapour present in the air is known as humidity. It is expressed quantitatively in different ways" (NCERT). Three measures matter, and each answers a different question.
Absolute humidity: how much vapour is in a cubic metre
"The actual amount of the water vapour present in the atmosphere is known as the absolute humidity. It is the weight of water vapour per unit volume of air and is expressed in terms of grams per cubic metre" (NCERT). Because it is counted per unit volume, it changes when a parcel of air expands or is squeezed, even if no water is added or removed: the same vapour is spread through more or less space. NCERT adds that the ability of air to hold water vapour depends entirely on its temperature.
Specific humidity: vapour as a share of the mass of air
NCERT’s chapter does not define specific humidity. The US National Weather Service (NWS) glossary gives it as "In a system of moist air, the ratio of the mass of water vapor to the total mass of the system" (NWS glossary, "specific humidity"). Being a ratio of masses (often written as grams of vapour per kilogram of air), it does not change when the air expands or contracts. It changes only when water is added by evaporation or removed by condensation, which makes it the measure that follows a moving parcel of air honestly.
Relative humidity: how close to full
"The percentage of moisture present in the atmosphere as compared to its full capacity at a given temperature is known as the relative humidity. With the change of air temperature, the capacity to retain moisture increases or decreases and the relative humidity is also affected" (NCERT). So relative humidity can rise with no new water at all, simply because the air cools and its capacity falls. NCERT adds that it "is greater over the oceans and least over the continents", a broad generalisation to know as NCERT’s statement.
Saturation, dew point and frost point
"The air containing moisture to its full capacity at a given temperature is said to be saturated. It means that the air at the given temperature is incapable of holding any additional amount of moisture at that stage. The temperature at which saturation occurs in a given sample of air is known as dew point" (NCERT). When the dew point lies below freezing, the NWS calls it the frost point: "Dew point below freezing" (NWS glossary, "frost point"). Cooling to the dew point gives water droplets; cooling to a frost point gives ice crystals, as the notes on dew and frost below show.
Worked example: relative humidity and the dew point
A sample of air can hold at most 24 g of water vapour per cubic metre at its present temperature, and it holds 12 g. (Illustrative numbers, not measured values.) What is its relative humidity, and what happens if it cools?
- Relative humidity = vapour present ÷ capacity × 100 = 12 ÷ 24 × 100 = 50%.
- Cool the air without adding or removing water. The vapour present stays at 12 g, but the capacity falls with temperature, so the relative humidity rises.
- When the capacity has fallen to 12 g, relative humidity reaches 100%: the air is saturated.
- The temperature at which that happens is the dew point. Any further cooling forces vapour to condense.
Answer: 50% now; 100% at the dew point. The absolute amount of vapour did not change; only the capacity did.
Ways of describing water vapour in the air
| Measure | What it is | Expressed as | Changes when the air expands? |
|---|---|---|---|
| Absolute humidity | "the weight of water vapour per unit volume of air" (NCERT) | grams per cubic metre | yes: the same vapour fills more volume |
| Specific humidity | "the ratio of the mass of water vapor to the total mass of the system" (NWS) | a mass ratio, e.g. grams per kilogram | no: only evaporation or condensation change it |
| Relative humidity | moisture present as a percentage of full capacity at that temperature (NCERT) | per cent | yes: it follows temperature |
| Dew point | "The temperature at which saturation occurs" (NCERT) | °C | - |
| Frost point | "Dew point below freezing" (NWS) | °C | - |
Source: NCERT, Fundamentals of Physical Geography, Class XI, ch 10 "Water in the Atmosphere" (Reprint 2026-27); NWS glossary, "specific humidity"; NWS glossary, "frost point". Last column: follows from each definition.
Don't confuse
Absolute humidity is mass per volume; specific humidity is mass per mass; relative humidity is a percentage of capacity. A cooling parcel keeps its specific humidity, but its relative humidity climbs towards 100%. Dew point and frost point are temperatures, not amounts: the frost point is simply a dew point below 0 °C.
Evaporation, condensation and latent heat
Evaporation turns liquid water into vapour, and heat is what drives it (NCERT). The energy involved has a name. "Latent heat of vaporisation is the amount of heat energy required to convert a unit mass of a liquid into vapour without a change in temperature" (NCERT, 2026 reprint). Older (2020) copies of NCERT describe latent heat of vaporisation as a temperature; the 2026 wording, an amount of energy per unit mass, is the correct one. Moving air helps: "the greater the movement of air, the greater is the evaporation" (NCERT), because fresh, drier air keeps replacing the moist air next to the water.
"The transformation of water vapour into water is called condensation. Condensation is caused by the loss of heat" (NCERT). The NWS uses the word more widely, for "the physical process by which a vapor becomes a liquid or solid" (NWS glossary, "condensation"). In free air, condensation needs a surface to start on: "In free air, condensation results from cooling around very small particles termed as hygroscopic condensation nuclei. Particles of dust, smoke and salt from the ocean are particularly good nuclei because they absorb water" (NCERT). The NWS calls these cloud condensation nuclei, "Small particles in the air on which water vapor condenses and forms cloud droplets".
NCERT sums up the conditions: condensation also happens when moist air touches a colder object, and "Condensation, therefore, depends upon the amount of cooling and the relative humidity of the air." It "takes place when the dew point is lower than the freezing point as well as higher than the freezing point": above freezing it gives water (dew, fog, cloud droplets), below freezing it gives ice (frost, ice crystals).
Latent heat travels with the vapour
Latent heat is "Heat absorbed or released during a change of phase at constant temperature and pressure" (NWS glossary, "latent heat"). Evaporation takes in the heat (NCERT’s definition above); condensation gives the same heat back to the air around it. Vapour that evaporates from a tropical ocean and condenses in a cloud far away has carried heat with it. That released heat is why saturated air cools more slowly as it rises (see the lapse rates below), and it is the fuel of thunderstorms and tropical cyclones (see the tropical cyclones, thunderstorms and tornadoes part).
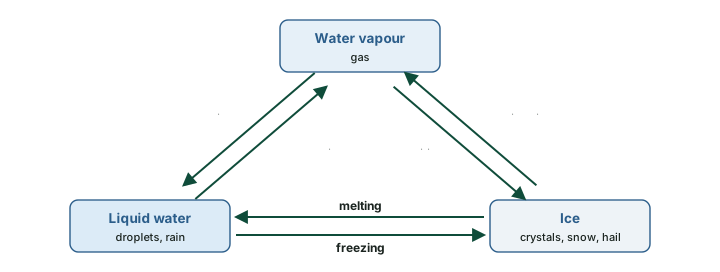
Water has three phases, and so six changes between them. Vapour turning straight to ice is deposition; ice turning straight to vapour is sublimation. Two cautions. The NWS glossary uses "sublimation" for both directions: "The transition of a substance from the solid phase directly to the vapor phase, or vice versa" (NWS glossary, "sublimation"). And the 2020 NCERT edition said that vapour condensing directly into solid "is known as sublimation"; the 2026 reprint removed that sentence. Frost on a winter windscreen forms by deposition.
Adiabatic cooling, lapse rates and stability
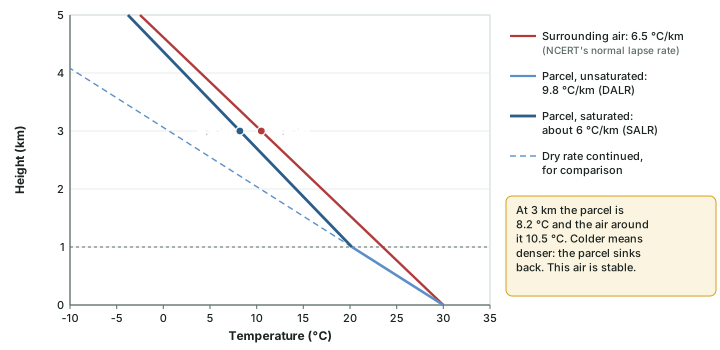
Most clouds form because air rises. Rising air moves into lower pressure (see the pressure and winds part), expands, and in expanding does work on the air around it, so it cools even though no heat leaves it. A change of temperature with no heat exchanged is called adiabatic. NCERT’s glossary defines the adiabatic lapse rate for rising or sinking air: "If no other non-adiabatic processes (i.e. no heat enters or leaves the system) occur (like condensation, evaporation and radiation), expansion causes the parcel of air to cool at a set rate of 0.98° per 100 m." Sinking air is compressed and warms at the same rate (NCERT glossary).
Three lapse rates
- Dry adiabatic lapse rate (DALR): the cooling of rising unsaturated air. "The dry adiabatic lapse rate (abbreviated DALR) is 5.5°F per 1000 ft or 9.8°C per km" (NWS glossary, "dry adiabatic lapse rate"), the same as NCERT’s 0.98° per 100 m.
- Saturated (moist) adiabatic lapse rate (SALR): the cooling of rising saturated air. Once the parcel is saturated, condensation releases latent heat inside it, so it cools more slowly. The rate is not fixed: the NWS says it "is not a constant like the dry adiabatic lapse rate but is dependent on parcel temperature and pressure" (NWS glossary, "moist adiabatic lapse rate"). NOAA’s Physical Sciences Laboratory gives the range: it "Can range from -4 °C/km to -9 °C/km but an average value is about -6 °C/km" (NOAA PSL, "How to read a skew-T").
- Environmental lapse rate (ELR): how fast the temperature of the still air around the parcel actually falls with height on a given day. It is measured, not calculated, and it varies. NCERT gives the normal (average) lapse rate as 6.5 °C per 1,000 m (NCERT, Fundamentals of Physical Geography, ch 8 (Reprint 2026-27)); the temperature part explains it and its reversal, the temperature inversion.
A rising parcel therefore cools at the dry rate until it reaches its dew point. The NWS names that height the lifting condensation level: "The level at which a parcel of moist air becomes saturated when it is lifted dry adiabatically" (NWS glossary, "Lifting Condensation Level (LCL)"). It is the flat base of a cumulus cloud. Above it, the parcel cools at the slower saturated rate.
Stable and unstable air
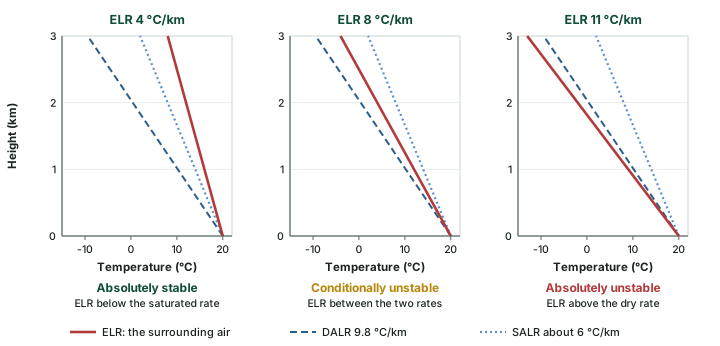
Whether a lifted parcel keeps rising depends on one comparison: is it warmer or colder than the air around it at the same height? Warmer air is less dense and keeps rising, like a hot-air balloon; colder air is denser and sinks back. Since the parcel cools at the adiabatic rates and the surroundings at the ELR, the comparison comes down to the lapse rates. The NWS defines the three cases (NWS glossary, "stable air"):
- Absolutely stable: "the environmental lapse rate is less than the moist adiabatic lapse rate". A lifted parcel, dry or saturated, ends up colder than its surroundings and sinks back.
- Conditionally unstable: "the environmental lapse rate is less than the dry adiabatic lapse rate but greater than the moist adiabatic lapse rate". Unsaturated air is stable, but once lifted past its condensation level the parcel can become warmer than its surroundings and rise on its own.
- Absolutely unstable: "the environmental lapse rate is greater than the dry adiabatic lapse rate". Any lifted parcel is warmer than its surroundings and accelerates upward.
Unstable air is "Air that is able to rise easily, and has the potential to produce clouds, rain, and thunderstorms" (NWS). Stable air resists vertical motion, so its clouds, if any, spread in flat layers. A temperature inversion (see the temperature part), where temperature rises with height, has a negative ELR, far below the moist rate: by the NWS definition it is absolutely stable, which is why it traps fog and smoke.
Worked example: is the air stable?
A parcel at 30 °C is lifted from the ground. It saturates at 1 km. Use 9.8 °C/km below the cloud base and 6 °C/km above it. Is the parcel warmer or colder than its surroundings at 3 km if the ELR is (a) 6.5 °C/km, (b) 8 °C/km?
- Parcel at 1 km: 30 - 9.8 × 1 = 20.2 °C.
- Parcel at 3 km: 20.2 - 6 × 2 = 8.2 °C.
- (a) Surroundings at 3 km: 30 - 6.5 × 3 = 10.5 °C. The parcel is 2.3 °C colder: it sinks back.
- (b) Surroundings at 3 km: 30 - 8 × 3 = 6.0 °C. The parcel is 2.2 °C warmer: it keeps rising.
Answer: (a) stable at 3 km; (b) unstable once saturated. Case (b) is conditional instability: the ELR of 8 °C/km lies between the saturated and dry rates.
Don't confuse
The ELR describes the surrounding air and is measured; the DALR and SALR describe a moving parcel and follow from physics. The DALR is fixed at 9.8 °C/km; the SALR varies (about 4 to 9 °C/km, average about 6). The same rates run in reverse in sinking air, which is why air descending a mountain arrives warm and dry: the local winds part works through the föhn with these numbers.
Forms of condensation: dew, frost, fog, mist, haze and smog
Where condensation happens decides what it looks like. On cold surfaces it gives dew or frost; in the air near the ground it gives fog or mist; high in free air it gives clouds (see clouds, below).
Dew and frost
Dew is moisture deposited as water droplets on cooler surfaces of solid objects, such as stones, grass blades and plant leaves, rather than on nuclei in the air above (NCERT). "The ideal conditions for its formation are clear sky, calm air, high relative humidity, and cold and long nights" (NCERT), and the dew point must be above freezing. Frost forms on cold surfaces when condensation takes place below freezing point, that is, when the dew point is at or below 0 °C; the excess moisture is deposited as minute ice crystals instead of droplets (NCERT). The ideal conditions for white frost are the same as for dew, except that the air temperature must be at or below freezing (NCERT).
Fog and mist
When an air mass holding a large quantity of water vapour cools suddenly, condensation takes place within it on fine dust particles, and a fog forms (NCERT). "Fogs are mini clouds in which condensation takes place around nuclei provided by the dust, smoke, and the salt particles" (NCERT). The difference between fog and mist is the most tested point here, and NCERT and the WMO frame it differently.
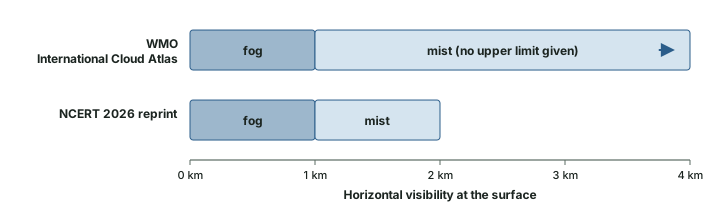
- NCERT (2026 reprint): "Fog reduces horizontal visibility on earths' [sic] surface to less than 1 km, while mist limits it to between 1 km and 2 km". NCERT also states that "The only difference between the mist and fog is that mist contains more moisture than the fog", that "Mists are frequent over mountains as the rising warm air up the slopes meets a cold surface", and that "Fogs are drier than mist and they are prevalent where warm currents of air come in contact with cold currents."
- WMO International Cloud Atlas: "The term 'fog' is used when microscopic droplets reduce horizontal visibility at the Earth's surface to less than 1 km, while the term 'mist' is used when the droplets do not reduce horizontal visibility to less than 1 km. In practice, mist is considered synonymous with 'light fog'." (WMO International Cloud Atlas, "Fog compared with mist")
The two agree on the 1 km line for fog. The WMO gives no 2 km upper limit for mist, and it treats fog and mist as the same droplets differing in how far one can see, not in how much moisture each droplet holds. For the exam, know NCERT’s 1 km and 2 km figures; for understanding, know that the WMO line is visibility alone.
Haze and smog
Haze is not condensation at all. The WMO defines it as "A suspension in the air of extremely small, dry particles invisible to the naked eye and sufficiently numerous to give the air an opalescent appearance" (WMO International Cloud Atlas, "Haze"). Haze is a lithometeor (dry particles), while fog and mist are hydrometeors (water droplets). Smog sits between the two: NCERT describes it as the condition when fog is mixed with smoke, and the WMO notes that "The term 'smog' (from the words 'smoke' and 'fog') is widely used for conditions where fog and heavy air pollution are present, with chemical reactions between the fog droplets and various pollutants" (WMO International Cloud Atlas, "Fog compared with mist"). Smog episodes are worst under a temperature inversion, which stops the polluted air from rising (see the temperature part).
Fog, mist, haze and smog
| Term | Made of | WMO International Cloud Atlas | NCERT 2026 reprint |
|---|---|---|---|
| Fog | water droplets (hydrometeor) | visibility reduced to less than 1 km | visibility less than 1 km |
| Mist | water droplets (hydrometeor) | visibility not reduced below 1 km; "synonymous with 'light fog'" | visibility 1 km to 2 km; "mist contains more moisture than the fog" |
| Haze | dry particles (lithometeor) | "extremely small, dry particles" giving an opalescent look | - |
| Smog | fog plus pollution | fog with heavy air pollution and chemical reactions | fog mixed with smoke |
Source: WMO International Cloud Atlas, "Fog compared with mist"; WMO International Cloud Atlas, "Haze"; NCERT, Fundamentals of Physical Geography, Class XI, ch 10 "Water in the Atmosphere" (Reprint 2026-27).
Exam tip
If a question asks for NCERT’s visibility range for mist, the answer is 1 km to 2 km. If it asks what separates fog from mist by international definition, the answer is visibility at the 1 km mark, not moisture content. Haze is dry; mist is wet.
Clouds
"Cloud is a mass of minute water droplets or tiny crystals of ice formed by the condensation of the water vapour in free air at considerable elevations" (NCERT). NCERT groups clouds by their height, expanse, density and transparency into four basic types:
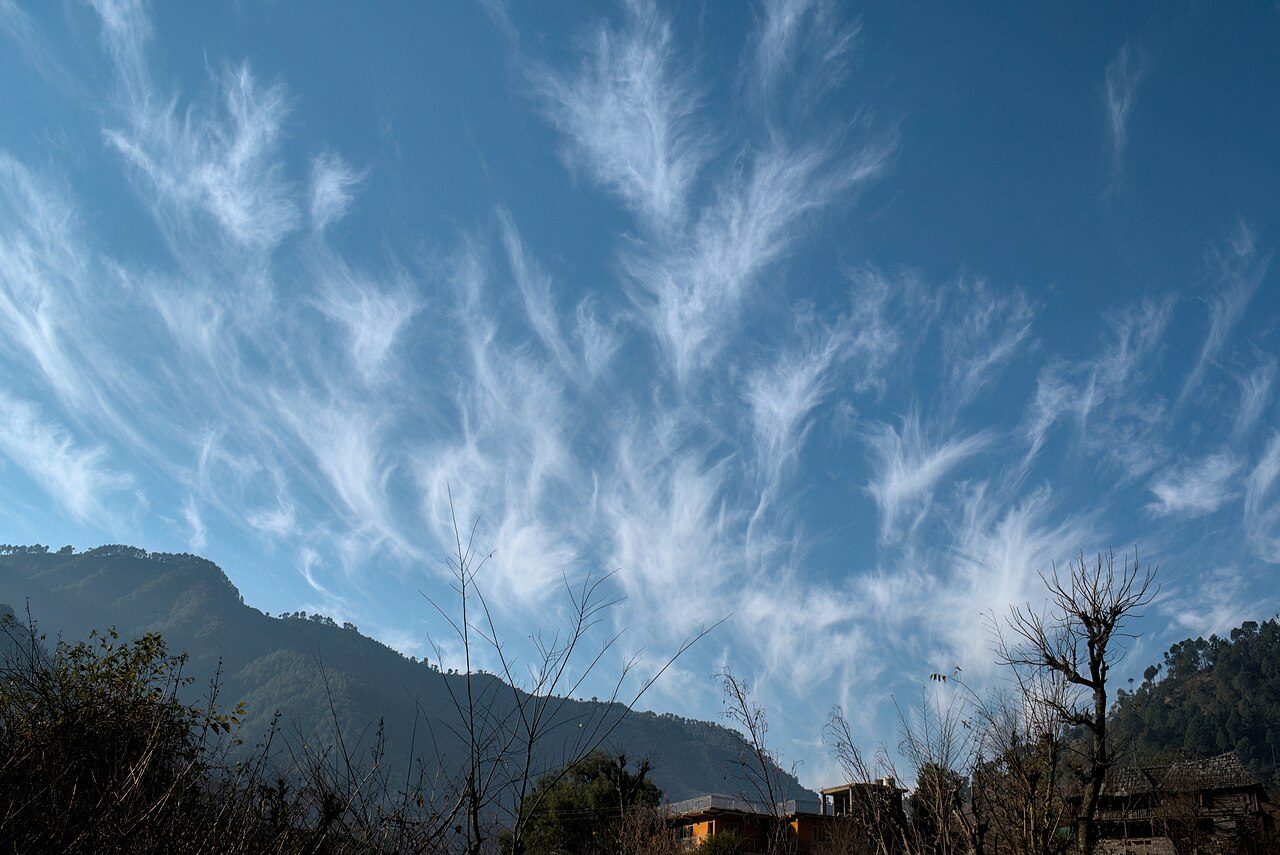
- Cirrus: "Cirrus clouds are formed at high altitudes (8,000 - 12,000m)." Thin, detached and feathery, always white (NCERT).
- Cumulus: "Cumulus clouds look like cotton wool. They are generally formed at a height of 4,000 - 7,000 m." They come in patches and have a flat base (NCERT).
- Stratus: layered clouds covering large parts of the sky, formed by loss of heat or by the mixing of air masses with different temperatures (NCERT).
- Nimbus: "Nimbus clouds are black or dark gray." They form at middle levels or very near the surface, and are extremely dense and opaque to the Sun’s rays (NCERT).
Combining these, NCERT lists high clouds (cirrus, cirrostratus, cirrocumulus), middle clouds (altostratus, altocumulus), low clouds (stratocumulus, nimbostratus) and clouds with extensive vertical development (cumulus, cumulonimbus).
The WMO classification: ten genera in three levels
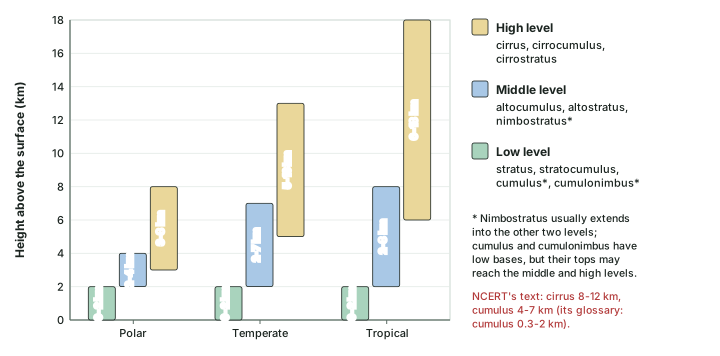
The international standard is the WMO International Cloud Atlas (2017 edition). It recognises ten cloud genera in three levels. "The troposphere can be vertically divided into three levels, formerly known as 'étages': high, middle and low... The levels overlap and their limits vary with latitude" (WMO International Cloud Atlas (2017 edition), "Clouds: definitions", Table 6). Clouds sit higher in the tropics, where the troposphere is deeper, than near the poles (the composition and structure part gives the tropopause heights). Two genera break the pattern: "Nimbostratus is almost always found in the middle level, but it usually extends into the other two levels; Cumulus and Cumulonimbus usually have their bases in the low level, but their vertical extent is often so great that their tops may reach into the middle and high levels" (WMO).
NCERT and the WMO differ in three places. NCERT’s text puts cumulus at 4,000 to 7,000 m, but its own glossary says cumulus clouds "are found in an altitude range from 300 - 2,000 m" (NCERT glossary), and the WMO puts cumulus bases in the low level, from the surface to 2 km. NCERT lists nimbostratus as a low cloud; the WMO places it in the middle level. And NCERT’s "clouds with extensive vertical development" is a useful family, but it is not one of the WMO’s three levels.
Exam tip
An examiner may quote NCERT’s main text (cumulus at 4,000-7,000 m, nimbostratus as low). Recognise that version, but know that the WMO and NCERT’s own glossary place cumulus bases below 2 km. Cumulonimbus, the thunderstorm cloud of the tropical cyclones, thunderstorms and tornadoes part, has its base in the low level and can tower into the high level.
The ten cloud genera
| Genus | WMO level (Cloud Atlas 2017) | NCERT 2026 grouping |
|---|---|---|
| Cirrus | High | high; one of the four basic types (8,000-12,000 m in the text) |
| Cirrocumulus | High | high |
| Cirrostratus | High | high |
| Altocumulus | Middle | middle |
| Altostratus | Middle | middle |
| Nimbostratus | Middle (usually extends into the other two levels) | low |
| Stratus | Low | one of the four basic types (layered) |
| Stratocumulus | Low | low |
| Cumulus | Low base; tops may reach the middle and high levels | vertical development; text 4,000-7,000 m, glossary 300-2,000 m |
| Cumulonimbus | Low base; tops may reach the middle and high levels | vertical development |
Source: WMO International Cloud Atlas (2017 edition), "Clouds: definitions", Table 6; NCERT, Fundamentals of Physical Geography, Class XI, ch 10 "Water in the Atmosphere" (Reprint 2026-27); NCERT, Fundamentals of Physical Geography, Class XI, Glossary (Reprint 2026-27).
Precipitation: how droplets grow and what falls
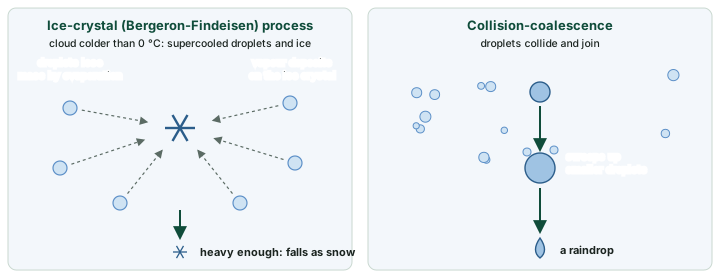
A cloud is not yet rain. Cloud droplets are tiny and are held up by the air. NCERT describes the step that matters: "The process of continuous condensation in free air helps the condensed particles to grow in size. When the resistance of the air fails to hold them against the force of gravity, they fall on to the earth’s surface." Meteorologists describe two ways the droplets grow large enough.
The ice-crystal (Bergeron-Findeisen) process
In a cloud colder than 0 °C, many droplets stay liquid (supercooled) beside a few ice crystals. The AMS Glossary of Meteorology explains why the ice wins: "the equilibrium vapor pressure of water vapor with respect to ice is less than that with respect to liquid water at the same subfreezing temperature". So "the ice crystals would gain mass by vapor deposition at the expense of the liquid drops that would lose mass by evaporation", and "Upon attaining sufficient weight, the ice crystals would fall as snow" (AMS Glossary of Meteorology, "Bergeron-Findeisen process"). The idea was "first proposed by T. Bergeron in 1933, and further developed by W. Findeisen", and it is "Commonly called the ice process of precipitation" (AMS).
Collision-coalescence
The second process needs no ice. Coalescence is "The process by which water droplets in a cloud collide and come together to form raindrops" (NWS glossary, "coalescence"). A drop that has grown larger than its neighbours collides with smaller droplets, joins them, and grows further, until it is heavy enough to fall as rain.
Forms of precipitation
- Rain: precipitation in the form of water (NCERT).
- Drizzle: "Precipitation consisting of numerous minute droplets of water less than 0.5 mm (500 micrometers) in diameter" (NWS glossary, "drizzle").
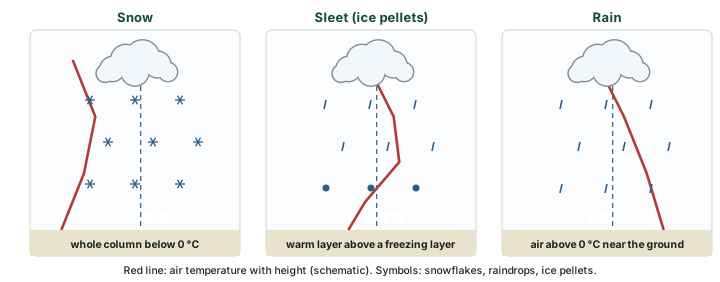
- Snow: when the temperature is below 0 °C, precipitation falls as fine flakes of snow; the moisture is released as hexagonal crystals, which form the flakes (NCERT).
- Sleet: "Sleet is frozen raindrops and refrozen melted snow-water. When a layer of air with the temperature above freezing point overlies a subfreezing layer near the ground, precipitation takes place in the form of sleet" (NCERT). This is the American meaning: the NWS defines ice pellets as "Same as Sleet ; defined as pellets of ice composed of frozen or mostly frozen raindrops or refrozen partially melted snowflakes" (NWS glossary, "ice pellets").
- Hail: raindrops released by clouds that freeze into small rounded pieces of ice as they pass through colder layers; "Hailstones have several concentric layers of ice one over the other" (NCERT). NCERT’s glossary gives their size as "between 5 and 190 mm in diameter". The heaviest hailstone in the WMO records weighed 1.02 kg, in Gopalganj district, Bangladesh, on 14 April 1986 (WMO, "Records of Weather and Climate Extremes", as of 31 July 2025).
NCERT notes that sleet and hail, unlike rain and snow, "are limited in occurrence and are sporadic in both time and space". Which form reaches the ground depends on the temperature of the air the precipitation falls through.
Don't confuse
Sleet (NCERT) and hail are both ice, but they form differently. Sleet is a raindrop that froze on the way down through a cold layer near the ground; it is small and has no layers. A hailstone has "several concentric layers of ice" (NCERT) and grows inside the cloud. Drizzle is liquid, with drops under 0.5 mm (NWS).
Types of rainfall
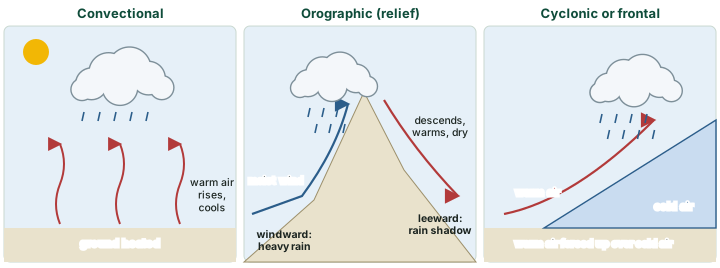
"On the basis of origin, rainfall may be classified into three main types – the convectional, orographic or relief and the cyclonic or frontal" (NCERT). All three are ways of lifting air until it cools to its dew point (see the lapse rates above); they differ in what does the lifting.
Convectional rain
Air heated at the ground becomes light and rises in convection currents; as it rises it expands and loses heat, condensation takes place and cumulus clouds form, followed by heavy rain with thunder and lightning that does not last long (NCERT). NCERT notes that such rain is common in summer and in the hotter part of the day, and is very common in the equatorial regions and the interior of the continents, especially in the northern hemisphere. In the language of the lapse rates above, strong heating steepens the ELR near the ground and makes the air unstable.
Orographic (relief) rain
"When the saturated air mass comes across a mountain, it is forced to ascend and as it rises, it expands; the temperature falls, and the moisture is condensed. The chief characteristic of this sort of rain is that the windward slopes receive greater rainfall" (NCERT). Having lost its moisture, the air descends the other side and warms at the dry adiabatic rate, so its relative humidity falls and the leeward slopes stay dry. The leeward area is the rain-shadow area, and NCERT notes that orographic rain is also known as relief rain.
India gives a sharp illustration of how uneven rainfall can be. NCERT’s India volume notes: "While Cherrapunji and Mawsynram in the Khasi Hills of Meghalaya receive rainfall over 1,080 cm in a year, Jaisalmer in Rajasthan rarely gets more than 9 cm of rainfall during the same period" (NCERT, India: Physical Environment, Class XI, ch 4 "Climate" (Reprint 2026-27)). How the monsoon winds bring that rain is explained on the Monsoon Mechanism, Jet Streams and Tropical Cyclones page.
Cyclonic or frontal rain
NCERT sends the reader to its circulation chapter for cyclonic rain. In these notes, the air masses and fronts part explains frontal rain: where a warm air mass meets a colder, denser one, the warm air is forced up over the cold wedge along the front, cools and gives long spells of rain. The tropical cyclones part covers the rain of tropical cyclones.
Why it happens
Why is the leeward side dry, and not just less wet? The descending air warms at the dry rate of 9.8 °C/km, faster than it cooled on the way up while saturated (about 6 °C/km). It reaches the leeward foot warmer than it started at the windward foot and with much of its water gone, so its relative humidity is low. The local winds part computes this for the föhn.
The three types of rainfall compared
| Convectional | Orographic (relief) | Cyclonic or frontal | |
|---|---|---|---|
| What lifts the air | heating of the ground | a mountain barrier in the wind’s path | warm air rising over cold air at a front |
| Typical cloud | cumulus, cumulonimbus | clouds on the windward slopes | layered cloud along the front (see air masses and fronts) |
| Character | heavy, short, with thunder and lightning (NCERT) | windward wet, leeward rain shadow | longer spells over wide areas (see air masses and fronts) |
| Where (NCERT) | equatorial regions; continental interiors, especially in the northern hemisphere; summer afternoons | windward slopes of mountains | mid-latitude cyclones (see air masses and fronts); tropical cyclones (see tropical cyclones) |
Source: NCERT, Fundamentals of Physical Geography, Class XI, ch 10 "Water in the Atmosphere" (Reprint 2026-27); the air masses and fronts and tropical cyclones parts of these notes.
World distribution of rainfall and the records
NCERT draws the world pattern in a few rules. "In general, as we proceed from the equator towards the poles, rainfall goes on decreasing steadily. The coastal areas of the world receive greater amounts of rainfall than the interior of the continents" (NCERT). Rainfall is greater over the oceans than over the land. Between about 35° and 40° N and S the rain is heavier on the eastern coasts and decreases westward; between 45° and 65° N and S, "due to the westerlies, the rainfall is first received on the western margins of the continents and it goes on decreasing towards the east" (NCERT). Where mountains run parallel to a coast, the coastal plain on the windward side gets the most rain.
By annual total, NCERT describes four regimes:
- Over 200 cm: "The equatorial belt, the windward slopes of the mountains along the western coasts in the cool temperate zone and the coastal areas of the monsoon land receive heavy rainfall of over 200 cm per annum."
- 100-200 cm: "Interior continental areas receive moderate rainfall varying from 100 - 200 cm per annum" (NCERT’s statement; the coastal areas of the continents also get moderate amounts).
- 50-100 cm: "The central parts of the tropical land and the eastern and interior parts of the temperate lands receive rainfall varying between 50- 100 cm per annum."
- Under 50 cm: areas in the rain shadow, the interiors of the continents and the high latitudes (NCERT).
NCERT adds that rainfall is spread evenly through the year in the equatorial belt and in the western parts of the cool temperate regions; elsewhere it is seasonal. The monsoon page and the El Niño page explain the seasonal and year-to-year swings in South Asia.
The WMO records
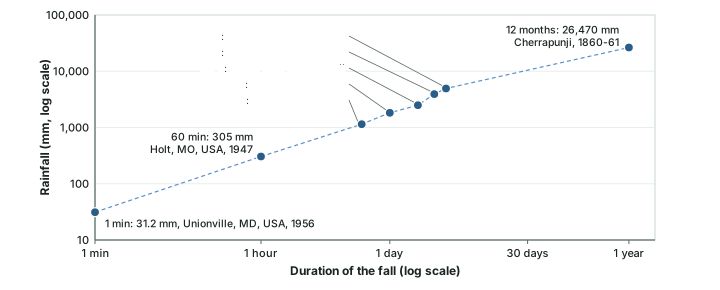
The WMO keeps the official list of weather and climate extremes, each checked by an evaluation panel. For rainfall it lists a separate record for each duration, from one minute to twelve months. The short-duration records belong to violent storms; the multi-day records belong to La Réunion, an island in the Indian Ocean, and to Cherrapunji in India (Meghalaya).
WMO world records for precipitation and hail
| Record | Value | Date | Place (as WMO prints it) |
|---|---|---|---|
| Greatest 1 min rainfall | 31.2 mm | 4 Jul 1956 | Unionville, MD, USA |
| Greatest 60 min rainfall | 305 mm | 22 Jun 1947 | Holt, MO, USA |
| Greatest 12 h rainfall | 1,144 mm | 7-8 Jan 1966 | Foc-Foc, La Réunion |
| Greatest 24 h rainfall | 1,825 mm | 7-8 Jan 1966 | Foc-Foc, La Réunion |
| Greatest 48 h rainfall | 2,493 mm | 15-16 Jun 1995 | Cherrapunji, India |
| Greatest 72 h rainfall | 3,930 mm | 24-26 Feb 2007 | Cratère Commerson, La Réunion |
| Greatest 96 h rainfall | 4,936 mm | 24-27 Feb 2007 | Cratère Commerson, La Réunion |
| Greatest 12 months rainfall | 26,470 mm | Aug 1860 to Jul 1861 | Cherrapunji, India |
| Heaviest hailstone (eastern hemisphere and world) | 1.02 kg | 14 Apr 1986 | Gopalganj district, Bangladesh |
| Heaviest hailstone (western hemisphere) | 0.88 kg | 23 Jul 2010 | Vivian, South Dakota (USA) |
| Longest dry period | 172 months | Oct 1903 to Jan 1918 | Arica, Chile |
Source: WMO, "Records of Weather and Climate Extremes", as of 31 July 2025. Values in mm as printed, converted from metres where WMO prints metres (e.g. 1.144 m = 1,144 mm). Cherrapunji is in Meghalaya (NCERT, India: Physical Environment, Class XI, ch 4 "Climate" (Reprint 2026-27)).
Remember
Cherrapunji’s 26.47 m is a 12-month record (August 1860 to July 1861), not a calendar-year or "annual" record. Cherrapunji also holds the 48-hour record (2,493 mm, 15-16 June 1995). Mawsynram, nearby, holds a different kind of record: the greatest average annual precipitation in WMO Region II (Asia), 11.872 m over 38 years (WMO).
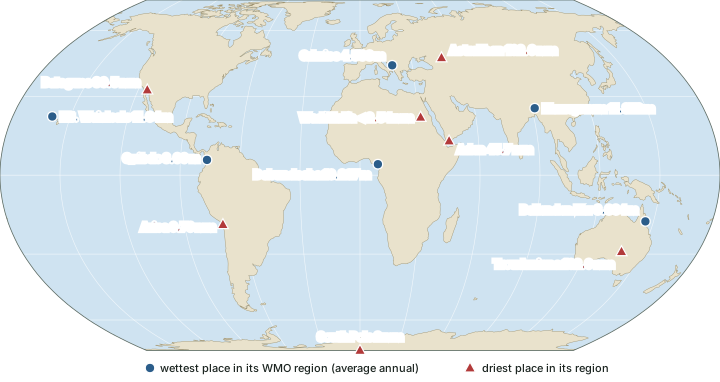
The WMO also lists the wettest and driest places of each region by average annual precipitation. Among the regional wettest places in the table, Mawsynram’s 11.872 m is the largest value; the WMO lists these as regional records, not as one world record. The driest averages belong to Arica in Chile (0.76 mm over 59 years) and to Wadi Halfa in Sudan (less than 2.54 mm over 39 years). Arica also holds the WMO record for the longest dry period: 172 months, from October 1903 to January 1918.
Wettest and driest places by WMO region (average annual precipitation)
| WMO region | Wettest | Driest |
|---|---|---|
| I: Africa | Debundscha, Cameroon: 10.287 m (32 years) | Wadi Halfa, Sudan: < 2.54 mm (39 years) |
| II: Asia | Mawsynram, India (Meghalaya): 11.872 m (38 years) | Aden, Yemen: 45.7 mm (50 years) |
| III: South America | Quibdo, Colombia: 8.99 m (29 years) | Arica, Chile: 0.76 mm (59 years) |
| IV: North America | Henderson Lake, BC, Canada: 7 m (15 years (1923-1935; 1998-2000)) | Batagues, Mexico: 30.5 mm (14 years) |
| V: South-West Pacific | Mt. Waialeale, Kauai, Hawaii, USA: 11.64 m (30 years); Bellenden Ker, Queensland, Australia (Australia only): 8.034 m (34 years) | Troudaninna, South Australia: 102.9 mm (42 years) |
| VI: Europe | Crkvice, Montenegro: 4.593 m (30 years (1961-1990)) | Astrakhan, Russian Federation: 162.6 mm (25 years) |
| Antarctic region | - | Amundsen-Scott South Pole Station: 2 mm (10 years) |
Source: WMO, "Records of Weather and Climate Extremes", as of 31 July 2025. Mt. Waialeale is listed as "Greatest precipitation" over 30 years; the driest entry for Europe is for continental Europe. Meghalaya: NCERT, India: Physical Environment, Class XI, ch 4 "Climate" (Reprint 2026-27).
Summary
- Humidity is measured three ways: absolute (g per m³, changes as air expands), specific (mass ratio, kept by a moving parcel) and relative (per cent of capacity, follows temperature). Saturation is reached at the dew point; below 0 °C it is the frost point.
- Evaporation absorbs latent heat; condensation releases it. Condensation needs cooling and hygroscopic nuclei (dust, smoke, sea salt).
- Rising air cools at 9.8 °C/km while unsaturated and at about 6 °C/km (4 to 9) once saturated. Comparing these with the ELR decides stability: below the saturated rate, absolutely stable; between the two, conditionally unstable; above the dry rate, absolutely unstable.
- Fog cuts visibility below 1 km (NCERT and WMO); NCERT gives mist 1 to 2 km, the WMO no upper limit. Haze is dry particles; smog is fog with pollution.
- The WMO recognises ten cloud genera in high, middle and low levels whose heights vary with latitude; NCERT’s text gives cumulus heights that its own glossary and the WMO do not support.
- Droplets grow by the ice-crystal (Bergeron-Findeisen) process and by collision-coalescence. NCERT’s sleet is the American ice pellet.
- Rain is convectional, orographic or frontal; the leeward side of a range lies in rain shadow.
- Rainfall decreases from the equator to the poles and from coasts to interiors. WMO records: 1,825 mm in 24 h at Foc-Foc (La Réunion, 1966); 26.47 m in 12 months at Cherrapunji (1860-61); Mawsynram 11.872 m average annual, the Asia regional record.
Paired terms at a glance
| Pair | The difference |
|---|---|
| Absolute vs specific vs relative humidity | mass per volume vs mass per mass vs per cent of capacity |
| Dew point vs frost point | saturation temperature above 0 °C (droplets) vs below 0 °C (ice) |
| DALR vs SALR vs ELR | 9.8 °C/km fixed vs about 6 °C/km variable (both for a moving parcel) vs the measured fall in the surrounding air |
| Stable vs unstable air | a lifted parcel ends colder than its surroundings and sinks vs ends warmer and rises |
| Fog vs mist | visibility below 1 km vs 1 km or more (NCERT: up to 2 km) |
| Haze vs mist | dry particles (lithometeor) vs droplets (hydrometeor) |
| Deposition vs sublimation | vapour to ice vs ice to vapour |
| Ice-crystal process vs coalescence | ice grows at the expense of supercooled droplets vs droplets collide and merge |
| Sleet vs hail | raindrops frozen in a cold layer near the ground vs layered ice grown in the cloud |
| Convectional vs orographic vs frontal rain | lifted by heating vs by a mountain vs by a cold-air wedge |
| 12-month vs average annual record | Cherrapunji 26.47 m (1860-61) vs Mawsynram 11.872 m (38-year average) |
Sources: NCERT, Fundamentals of Physical Geography, Class XI, ch 10 "Water in the Atmosphere" (Reprint 2026-27); NWS glossary; WMO International Cloud Atlas (2017 edition), "Clouds: definitions", Table 6; WMO, "Records of Weather and Climate Extremes", as of 31 July 2025.
Sources
Each table and data figure names its source beneath it. The main documents are collected here, with a date where the source carries one. Figures not listed under image credits were drawn for this page from the sources stated in their source lines.
Main sources
| Topic | Source |
|---|---|
| Textbook | NCERT, Fundamentals of Physical Geography, Class XI, ch 10 "Water in the Atmosphere" (Reprint 2026-27), and its Glossary; normal lapse rate from ch 8 (Reprint 2026-27) |
| Indian rainfall contrasts | NCERT, India: Physical Environment, Class XI, ch 4 "Climate" (Reprint 2026-27) |
| Humidity, condensation, latent heat, lapse rates, stability, precipitation forms | NWS glossary: "specific humidity", "frost point", "condensation", "latent heat", "sublimation", "dry adiabatic lapse rate", "moist adiabatic lapse rate", "stable air", "coalescence", "drizzle", "ice pellets" |
| Range of the saturated lapse rate | NOAA PSL, "How to read a skew-T" |
| Fog, mist, haze and cloud levels | WMO International Cloud Atlas (2017 edition): "Fog compared with mist", "Haze", "Clouds: definitions" |
| Ice-crystal process | AMS Glossary of Meteorology, "Bergeron-Findeisen process" |
| Rainfall, hail and dry-period records | WMO, "Records of Weather and Climate Extremes", as of 31 July 2025 |
Image credits
| Image | Credit and licence |
|---|---|
| Cirrus over Nandli, near Mandi, Himachal Pradesh, India, 17 January 2021 | ADARSHluck. CC BY-SA 4.0, via Wikimedia Commons. File page |
| Altocumulus with cumulus over Gåseberg, Lysekil, Sweden, 29 August 2016 | W.carter. CC BY-SA 4.0, via Wikimedia Commons. File page |
| Cumulus humilis over the Southern Tablelands of New South Wales, Australia, 1 December 2009 | Toby Hudson. CC BY-SA 3.0, via Wikimedia Commons. File page |
| All other figures | Drawn for this page from the sources given in their source lines. |