 BharatNotes
Part 3 of 11 of the Atmosphere and Climatology notes. The overview page has the quick revision and exam strategy for all eleven parts.
Temperature: Distribution, Range and Inversion
The insolation and heat budget part showed how much energy each latitude receives. This part turns that energy into temperature: what makes one place warmer than another, why temperature usually falls with height, how temperature is mapped with isotherms, why some places swing between extremes while others hardly change, and why, on some nights, the air above is warmer than the air at the ground.
Cross-paper relevance
- GS1 (Geography, primary): the controls of temperature, lapse rates, isotherms, the daily and annual range, and temperature inversion
- GS3 (Environment): why smoke and dust stay trapped near the ground under a winter surface inversion, and the rise in global mean temperature above the 1850–1900 average
Heat, temperature and their controls
Heat and temperature are not the same thing. Heat is energy; temperature is the measure, in degrees, of how hot or cold something is.
NCERT lists the factors that control the temperature of a place: its latitude, its altitude, its distance from the sea, the air masses that pass over it, the ocean currents off its coast, and local aspects such as the direction a slope faces. Latitude works through insolation (see the insolation and heat budget part): the lower the latitude, the higher the Sun and the more energy each square metre receives. The other controls bend that simple pattern, as the rest of this part shows.
Remember
Six controls of temperature (NCERT): latitude, altitude, distance from the sea, air masses, ocean currents, local aspects. Latitude sets the basic pattern; the rest modify it.
Temperature and height: the lapse rates
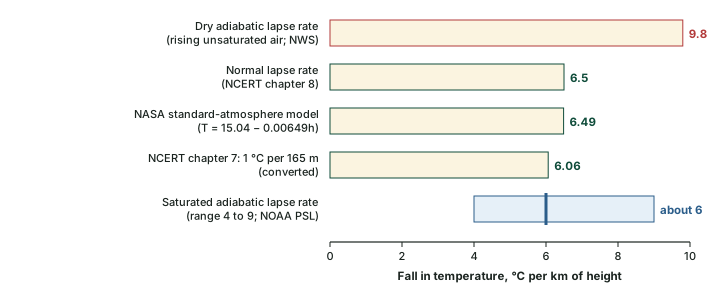
The atmosphere is heated from below (see the insolation and heat budget part), so in the troposphere it is normally coldest high up. NCERT: "The rate of decrease of temperature with height is termed as the normal lapse rate. It is 6.5°C per 1,000 m." So the higher a place, the colder it normally is: a hill station is cooler than the plains below it. NCERT's ch 7 gives the same idea as a fall of 1 °C for every 165 m, which works out at about 6.1 °C per km (computed). The standard-atmosphere model NASA uses for the troposphere, T = 15.04 − 0.00649h (h in metres), falls by 6.49 °C per km, the same as NCERT's 6.5 to one decimal place.
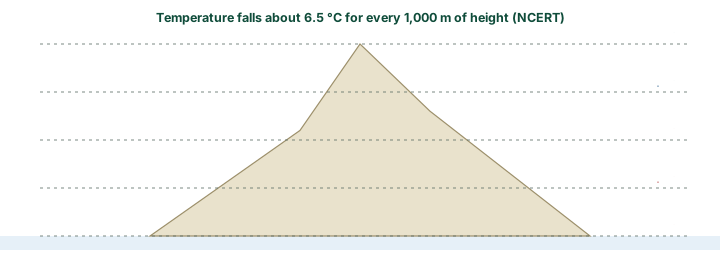
Worked example: How cold is the hill station?
The temperature at a coastal town at sea level is 30 °C. Using the normal lapse rate, what should the air temperature be at a hill station 2,200 m up?
- Normal lapse rate: 6.5 °C per 1,000 m (NCERT).
- Height difference: 2,200 m = 2.2 thousand metres.
- Fall in temperature: 6.5 × 2.2 = 14.3 °C.
- Temperature at the hill station: 30 − 14.3 = 15.7 °C.
Answer: about 15.7 °C. Real readings differ, because the actual lapse rate changes with time, place and weather.
The normal lapse rate describes the air that is standing still around us: it is the environmental lapse rate, read by a balloon rising through the air. A different number applies to a parcel of air that is itself rising. As it rises it expands, and expansion cools it, even though no heat is taken away. This is adiabatic cooling. Rising air that is not saturated cools at the dry adiabatic lapse rate of 9.8 °C per km (NWS glossary, "dry adiabatic lapse rate"). Once the air is saturated, condensation releases latent heat, and the parcel cools more slowly: the saturated adiabatic lapse rate varies between about 4 and 9 °C per km, about 6 on average (NOAA PSL; NOAA's Storm Prediction Center gives a value near 6, SPC).
Don't confuse
The environmental lapse rate (about 6.5 °C per km) is measured in the still air around a rising balloon. The adiabatic lapse rates (9.8 dry, about 6 saturated) describe air that is itself rising and cooling by expansion. Comparing the two tells you whether air is stable or unstable: the water in the atmosphere part explains how.
Land and sea
NCERT: "Compared to land, the sea gets heated slowly and loses heat slowly. Land heats up and cools down quickly." The temperature of the sea therefore varies less than that of the land, and places near the sea come under its moderating influence through sea and land breezes (NCERT; the local winds part explains the breezes). An interior place is hotter by day and in summer and colder by night and in winter than a coastal place at the same latitude. The diagram below sketches the daily cycle.
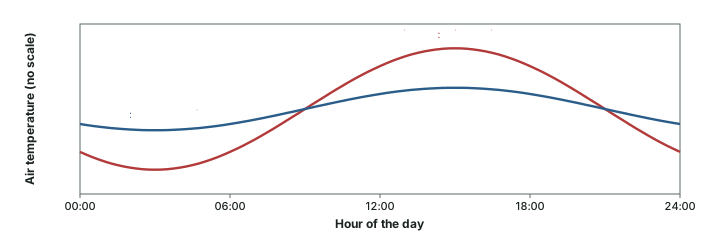
Ocean currents and air masses work the same way on a larger scale. A coast washed by a warm current, or reached by air that comes from a warm source region, is warmer than its latitude suggests; a cold current or a cold air mass lowers temperature (NCERT lists both among the controls). The North Atlantic in winter is the classic case, shown below.
Distribution of temperature: isotherms
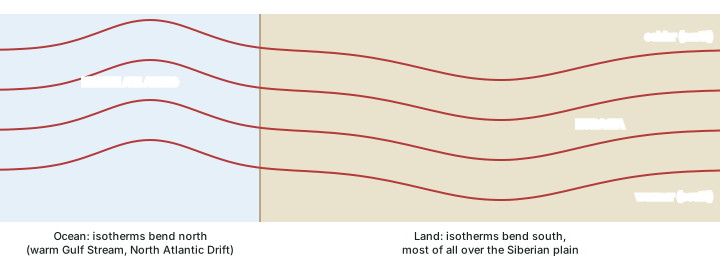
Temperature is mapped with isotherms. NCERT: "The Isotherms are lines joining places having equal temperature." Because latitude is the main control, isotherms run roughly parallel to the lines of latitude. Where they bend, another control is at work. NCERT notes that the bending is more marked in January than in July, and more in the Northern Hemisphere, which has much more land than the Southern.
In January, "the isotherms deviate to the north over the ocean and to the south over the continent" (NCERT). Over the North Atlantic, the warm Gulf Stream and North Atlantic Drift keep the ocean warm and push the isotherms north. Over the land the temperature falls sharply and the isotherms swing south in Europe, most of all over the Siberian plain. NCERT gives a striking case: along 60° E the mean January temperature is −20 °C both at 80° N and at 50° N.
January and July temperatures: NCERT's key statements
| Month | Where | Temperature (NCERT) |
|---|---|---|
| January | equatorial oceans | more than 27 °C |
| January | tropics | more than 24 °C |
| January | middle latitudes | 2 °C to 0 °C |
| January | interior of Eurasia | −18 °C to −48 °C |
| January | Southern Hemisphere | isotherms of 20 °C, 10 °C and 0 °C run parallel to 35° S, 45° S and 60° S |
| July | equatorial oceans | more than 27 °C |
| July | subtropical continental Asia, along 30° N | more than 30 °C |
| July | along 40° N and 40° S | about 10 °C |
Source: NCERT, Fundamentals of Physical Geography, Class XI, ch 8 "Solar Radiation, Heat Balance and Temperature" (Reprint 2026-27)
Exam tip
In a map question, ask which way the isotherm bends and why. Northward bends over a northern ocean in January mean warm water; southward bends over land mean a cold interior.
Range of temperature
The daily (diurnal) range is the difference between the highest and lowest temperatures of a day; the annual range is the difference between the mean temperatures of the warmest and coldest months. Both are larger over land than over the sea, because land heats and cools quickly while the sea heats and cools slowly (NCERT).
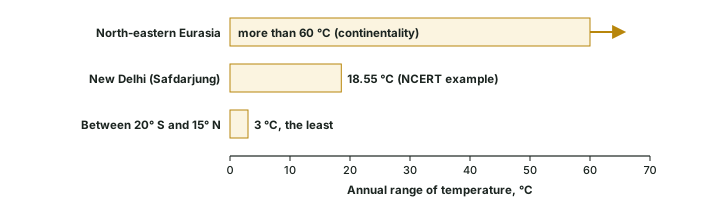
NCERT gives the two ends of the world's annual range. The highest, more than 60 °C, is over the north-eastern part of Eurasia, "due to continentality". The least, 3 °C, is found between 20° S and 15° N.
Worked example: Annual range at New Delhi (Safdarjung)
NCERT's example table for New Delhi (Safdarjung), based on 1951–1980 observations, gives a mean daily maximum of 21.1 °C and a mean daily minimum of 7.3 °C for January, and 39.6 °C and 25.9 °C for May. Find the annual range in NCERT's way.
- January mean = (21.1 + 7.3) ÷ 2 = 14.2 °C.
- May mean = (39.6 + 25.9) ÷ 2 = 32.75 °C.
- Annual range = 32.75 − 14.2 = 18.55 °C.
Answer: 18.55 °C. The NCERT table gives only January and May.
Inversion of temperature
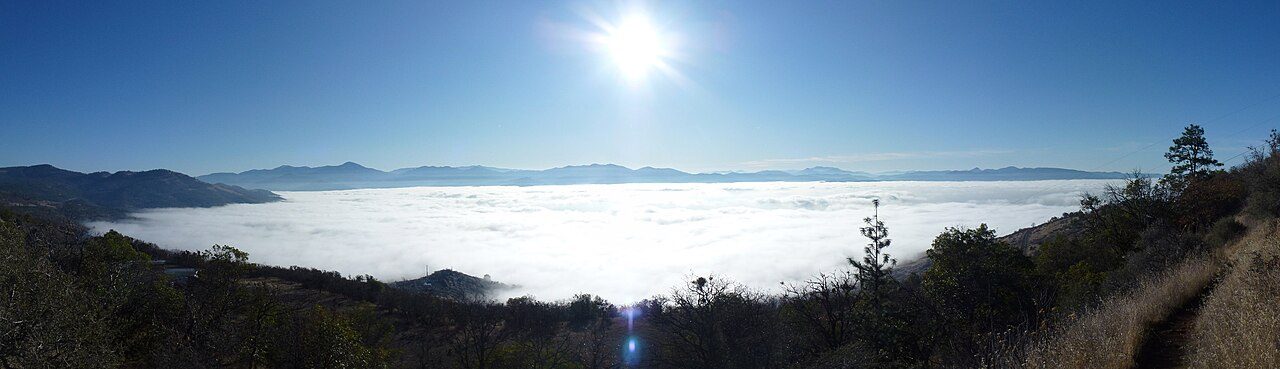
Normally temperature falls with height. At times the situation is reversed and temperature rises with height through a layer of air. NCERT calls this inversion of temperature and notes that it is usually short-lived but common. The ideal conditions: "A long winter night with clear skies and still air is ideal situation for inversion." The heat of the day is radiated away during the long night, the ground cools quickly, and the air touching it is chilled from below; by early morning the ground is cooler than the air above it (NCERT).
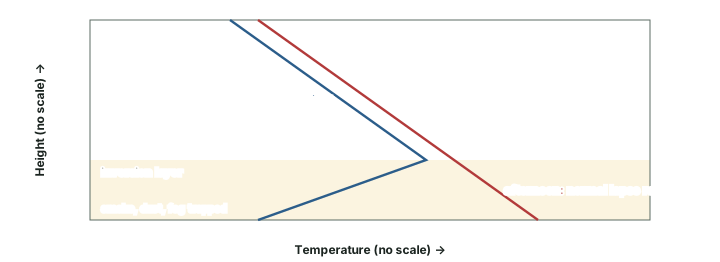
A surface inversion makes the lowest air stable: cold, dense air at the bottom has no tendency to rise. Smoke and dust collect beneath the inversion and spread sideways, and dense fogs form on winter mornings (NCERT). Such an inversion usually lasts only a few hours and breaks as the Sun heats the ground. Over the polar areas it is different: NCERT notes that "Over polar areas, temperature inversion is normal throughout the year."
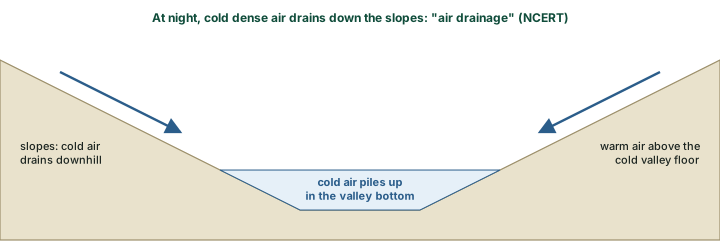
Hills and mountains add air drainage. At night the slopes cool, and the cold, dense air on them flows downhill. NCERT says the cold air "acts almost like water", and it collects to "pile up deeply in pockets and valley bottoms with warm air above". NCERT notes the practical result: "It protects plants from frost damages."
Not every inversion starts at the ground. The glossary of the US National Weather Service (NWS glossary, "inversion") describes several kinds. A radiational inversion is the night-time surface inversion already described. A subsidence inversion forms when a large mass of air sinks and is warmed by compression; it is usually found with the subtropical high-pressure areas (see the general circulation and jet streams part). A frontal inversion forms where warm air rides up over cold air at a front (see the air masses and fronts part). Along some coasts a marine inversion forms where cool sea air lies under warmer air. A strong inversion above the ground acts as a lid, or cap: it suppresses or delays the growth of thunderstorms, and if it breaks, storms can develop explosively (NWS).
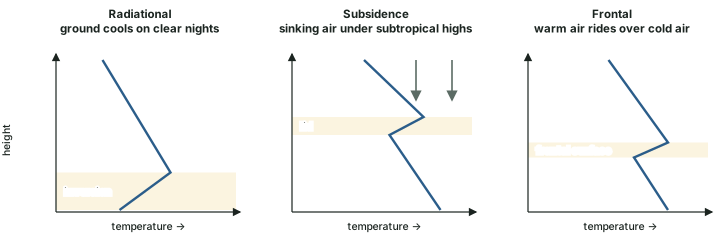
Kinds of temperature inversion
| Kind | How it forms | Where and when | Effect |
|---|---|---|---|
| Radiational (surface) | the ground cools by radiation and chills the air touching it | long, clear, calm winter nights; all year over polar areas | stable air, fog, smoke trapped near the ground |
| Air drainage (valley) | cold air flows down slopes and pools in valleys | hills and mountains at night | cold air piles up in valley bottoms, warm air above (NCERT) |
| Subsidence | sinking air is warmed by compression | under the subtropical highs | a lid of warmer air aloft |
| Frontal | warm air overruns cold air | at fronts | a sloping inversion along the front |
| Marine | cool sea air lies under warmer air | some coasts | a cool layer near the surface |
Source: NCERT, Fundamentals of Physical Geography, Class XI, ch 8 "Solar Radiation, Heat Balance and Temperature" (Reprint 2026-27); NWS glossary, "inversion".
Why it happens
Under a surface inversion the air is stable, so smoke and dust stay low and "spread horizontally" (NCERT). On long, clear, calm winter nights this is how pollution builds up in the layer where people breathe.
Extremes and the warming world
The World Meteorological Organization keeps the official world records in its Archive of Weather and Climate Extremes. Its table (WMO, table as of 31 July 2025) gives the highest air temperature as 56.7 °C at Furnace Creek (Greenland Ranch), Death Valley, California, USA, on 10 July 1913, and the lowest as −89.2 °C at Vostok, Antarctica, on 21 July 1983.
World temperature records (WMO)
| Record | Value | Place | Date |
|---|---|---|---|
| Highest air temperature | 56.7 °C | Furnace Creek (Greenland Ranch), Death Valley, California, USA | 10 July 1913 |
| Lowest air temperature | −89.2 °C | Vostok, Antarctica | 21 July 1983 |
Source: WMO, "Records of Weather and Climate Extremes", as of 31 July 2025.
Don't confuse
NCERT (Fundamentals of Physical Geography, Class XI, ch 11, Reprint 2026-27) still states: "The highest shade temperature of 58° C was recorded at Al Aziziyah, Libya on 13 September 1922." A WMO Commission for Climatology panel (2010–2012) rejected it, and the WMO record is the 56.7 °C at Death Valley (WMO).
Records describe single places and days. The global mean tells the bigger story. WMO's State of the Global Climate 2025 (23 March 2026) puts the 2025 global mean near-surface temperature about 1.43 ± 0.13 °C above the 1850–1900 average, and 2024 remains the warmest year on record at about 1.55 °C (WMO). The climate change part explains the causes and the data behind these figures.
In the news
23 March 2026. WMO's State of the Global Climate 2025 put 2025 at about 1.43 ± 0.13 °C above the 1850–1900 average; 2024, at about 1.55 °C, is still the warmest year on record.
Summary
- Six controls set the temperature of a place (NCERT): latitude, altitude, distance from the sea, air masses, ocean currents and local aspects.
- The normal lapse rate is 6.5 °C per 1,000 m (NCERT). Rising air cools at 9.8 °C per km while dry and at about 4 to 9 °C per km once saturated.
- Land heats and cools quickly, the sea slowly; coasts have a smaller range than interiors.
- Isotherms run roughly along the parallels. In January they bend north over the North Atlantic and south over Eurasia.
- The annual range is more than 60 °C over north-eastern Eurasia and only 3 °C between 20° S and 15° N (NCERT).
- Inversions form on long, clear, calm winter nights, all year over the poles, in valleys by air drainage, and aloft by subsidence or at fronts.
- WMO records: 56.7 °C at Death Valley (1913) and −89.2 °C at Vostok (1983). 2025 was about 1.43 °C above 1850–1900 (WMO).
Normal lapse rate and inversion compared
| Feature | Normal lapse rate | Inversion |
|---|---|---|
| Temperature with height | falls, about 6.5 °C per 1,000 m | rises through a layer |
| Typical time | by day, most of the time | long, clear, calm winter nights; all year over the poles |
| Stability of the lowest air | can rise freely if warmed | stable: cold air stays below |
| Smoke and dust | carried upward and mixed | trapped below the inversion |
| Typical weather | convection and cumulus clouds possible | fog, haze and frost |
Source: NCERT, Fundamentals of Physical Geography, Class XI, ch 8 "Solar Radiation, Heat Balance and Temperature" (Reprint 2026-27)
Sources
Each table and data figure names its source beneath it. The main documents are collected here, with a date where the source carries one. Figures not listed under image credits were drawn for this page from the sources stated in their source lines.
Main sources
| Topic | Source |
|---|---|
| Textbook | NCERT, Fundamentals of Physical Geography, Class XI, ch 8 "Solar Radiation, Heat Balance and Temperature", ch 7 "Composition and Structure of Atmosphere" and ch 11 (Reprint 2026-27) |
| Standard atmosphere | NASA Glenn atmosphere model |
| Adiabatic lapse rates | NWS glossary, "dry adiabatic lapse rate"; NOAA PSL; NOAA Storm Prediction Center, SPC |
| Kinds of inversion | NWS glossary, "inversion" |
| World temperature records | WMO, "Records of Weather and Climate Extremes", as of 31 July 2025 |
| Al Aziziyah figure rejected | WMO |
| Global mean temperature, 2025 | WMO, State of the Global Climate 2025 (23 March 2026) |
Image credits
| Image | Credit and licence |
|---|---|
| The Rogue Valley inversion seen from Roxy Ann Peak, 4 December 2011 | Little Mountain 5. CC BY-SA 3.0, via Wikimedia Commons. File page |
| All other figures | Drawn for this page from the sources given in their source lines. |