 BharatNotes
Part 5 of 11 of the Atmosphere and Climatology notes. The overview page has the quick revision and exam strategy for all eleven parts.
The General Circulation and Jet Streams
The Sun heats the tropics more than the poles, and the atmosphere spends its whole life trying to even out the difference. The great wind belts of the planet, the cells that turn over the troposphere, and the narrow rivers of fast air near the tropopause are all parts of that single heat-moving machine. This part assembles it piece by piece, starting from the NCERT model and then adding what modern meteorology says about it.
Why the atmosphere circulates
The part on insolation and the heat budget showed that the tropics receive more solar energy than they radiate away, while high latitudes lose more than they receive. If nothing moved heat polewards, the tropics would keep warming and the poles keep cooling. Winds and ocean currents do the moving. NCERT puts the general circulation in one line: "The transfer of heat energy from lower latitudes to higher latitudes maintains the general circulation."
NCERT lists five factors that shape the pattern of planetary winds: (i) the latitudinal variation of atmospheric heating; (ii) the emergence of pressure belts; (iii) the migration of the belts following the apparent path of the Sun; (iv) the distribution of continents and oceans; and (v) the rotation of the Earth. "The pattern of the movement of the planetary winds is called the general circulation of the atmosphere." Rotation matters because of the Coriolis force (see pressure and winds): air that starts moving towards the pole or the equator is turned aside, so the belts end up running east-west rather than north-south.
Key idea
The general circulation is a heat engine. Heating is strongest near the equator, so air rises there; it must sink somewhere and return. Rotation breaks the simple equator-to-pole loop into belts, and the belts carry the heat.
From one cell to three
Hadley's idea (1735)
The first physical explanation of the trade winds that is still taught came from George Hadley, in a short paper titled "Concerning the cause of the general trade-winds", published in the Philosophical Transactions of the Royal Society in 1735 (volume 39, pages 58-62). Hadley reasoned that air heated near the equator rises, cooler air flows in at the surface to replace it, and the Earth's rotation turns that inflow so it arrives from the east. His reasoning was qualitative, and the rotational part of it was later corrected by Ferrel and others. The tropical overturning cell still carries his name.
A single cell stretching from equator to pole does not survive on a rotating planet. Poleward-moving air aloft is deflected so strongly that it becomes a westerly wind and cannot carry on to the pole. Stull's account: the Coriolis force "prevents these upper-level winds from getting further away from the equator than about 30° latitude (north and south), so the air accumulates". That pile-up near 30° is where the tropical cell ends.
The three-cell model
NCERT describes the model in sequence. Air at the Inter Tropical Convergence Zone (ITCZ) rises because of convection caused by high insolation, creating low pressure. The converged air "reaches the top of the troposphere up to an altitude of 14 km. and moves towards the poles. This causes accumulation of air at about 30° N and S." Part of the accumulated air sinks and forms the subtropical high; "Another reason for sinking is the cooling of air when it reaches 30° N and S latitudes." Near the surface the air flows back to the equator as the easterlies, which converge at the ITCZ. This loop is the Hadley cell.
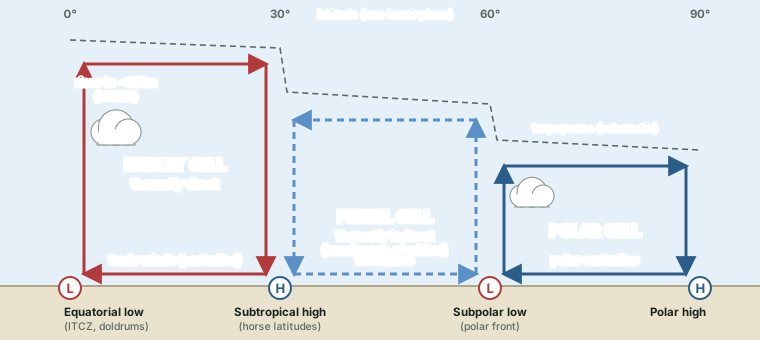
In the middle latitudes, NCERT continues, "the circulation is that of sinking cold air that comes from the poles and the rising warm air that blows from the subtropical high. At the surface these winds are called westerlies and the cell is known as the Ferrel cell." At polar latitudes "the cold dense air subsides near the poles and blows towards middle latitudes as the polar easterlies. This cell is called the polar cell."
Stull gives the usual limits: the Hadley cell runs from the equator to about 30°, the Ferrel cell from about 30° to 60°, and the polar cell from about 60° to the pole ("Air generally rises near 60°N and descends near the pole"). These are textbook round numbers. The Met Office puts the edge of the Hadley cells at "about 30-40" degrees of latitude and the Ferrel cells "between 30-40 and 60-70" degrees, a reminder that the boundaries move with season and longitude.
The Ferrel cell is not like the other two
The Hadley and polar cells are thermally direct: warm air rises and cold air sinks, turning heat into motion. The Ferrel cell runs the other way round, with relatively cold air rising near 60° and warmer air sinking near 30°. Nothing at that latitude drives such a loop directly. In modern meteorology it is the averaged footprint of the mid-latitude storms and waves that carry most of the heat there. In Stull's words: "Rossby waves so efficiently transport heat and momentum at midlatitudes that the effective vertical circulation is negative. This indirect circulation is called the Ferrel cell."
Don't confuse
NCERT's description of the Ferrel cell (sinking polar air, rising subtropical air, surface westerlies) is the exam baseline and is correct as a picture of the average. Do not write that the Ferrel cell is "driven by" the Hadley and polar cells like a gear between two wheels. It is thermally indirect: the zonal-mean result of eddies (cyclones and Rossby waves), which do the real work of moving heat in the middle latitudes.
The three cells compared
| Cell | Latitudes (approx.) | Rising / sinking | Surface winds | Type |
|---|---|---|---|---|
| Hadley | 0° to ~30° | rises at the ITCZ (up to ~14 km, NCERT); sinks near 30° | trade winds (easterlies) | thermally direct |
| Ferrel | ~30° to ~60° | average sinking near 30°, rising near 60° | westerlies | thermally indirect (zonal mean of eddies) |
| Polar | ~60° to the pole | rises near 60°, sinks at the pole | polar easterlies | thermally direct |
Source: NCERT, Fundamentals of Physical Geography, Class XI, ch 9 "Atmospheric Circulation and Weather Systems" (Reprint 2026-27); R. Stull, Practical Meteorology (Univ. of British Columbia, via LibreTexts), sections 11.7, 11.12.
What the Hadley cell does to the tropics
Stull draws out three consequences worth knowing. First, the vigorous circulation "spreads and horizontally mixes the radiatively warmed air somewhat uniformly between ±30° latitude", so temperature changes little across the tropics. Second, the temperature change between equator and pole "has been compressed to a latitude band of about 30 to 60° in each hemisphere", which is why the strong westerlies, the polar front and the storms live there. Third, the air that sinks near 30° "warms dryadiabatically, and does not contain much moisture because it was squeezed out earlier in the thunderstorm updrafts. These are the latitudes of the subtropical deserts."
The sinking air also caps the moist air below it with a temperature inversion, the trade inversion. Its base is lowest, of the order of 500 m, in the subtropics and highest, of the order of 2,500 m, near the ITCZ (Stull). Inversions are treated in the part on temperature.
Pressure belts and planetary winds
The cells leave a pattern of alternating low- and high-pressure belts at the surface. NCERT: near the equator lies the equatorial low; "Along 30° N and 30° S are found the high-pressure areas known as the subtropical highs. Further pole wards along 60° N and 60° S, the low-pressure belts are termed as the sub polar lows"; near the poles the pressure is high, the polar high. Winds blow from the highs towards the lows and are turned by the Coriolis force: to the right in the northern hemisphere, to the left in the southern (see pressure and winds).
Equatorial low, ITCZ and doldrums. The US National Weather Service defines the ITCZ as "the region where the northeasterly and southeasterly trade winds converge, forming an often continuous band of clouds or thunderstorms near the equator". The equatorial low-pressure trough lies under it. At the centre of that trough the pressure gradient is weak and winds are light: sailors called this light-wind zone the doldrums.
Subtropical highs and horse latitudes. NOAA's National Ocean Service: "The horse latitudes are regions located at about 30 degrees north and south of the equator. These latitudes are characterized by calm winds and little precipitation." The name, NOAA notes, comes "according to legend" from ships bound for the New World that were becalmed for days or weeks; they are also called the "calms of Cancer" and the "calms of Capricorn". The dry, sinking air explains the subtropical deserts; the Met Office names "deserts like the Sahara" under these highs.
Westerlies and the subpolar low. Between the subtropical highs and the subpolar lows the surface winds blow from the west. Near 60°, warm air from the subtropics meets cold polar air along the polar front; the US National Weather Service's training notes put it as "Warm air meets cold - polar front - Convergence zone of L pressure - subpolar Low". Fronts and the storms that form on them are the subject of the part on air masses and fronts.
Polar highs and polar easterlies. Cold, dense air subsides near the poles and flows out towards the middle latitudes as the polar easterlies (NCERT).
Don't confuse: ITCZ, equatorial low, doldrums
Equatorial low is a pressure belt; the ITCZ is defined by converging winds and a band of cloud; the doldrums are the light winds at the centre of the trough. They overlap in place but are three different ideas. In the same way, the horse latitudes are the calm zones under the subtropical highs, not the highs themselves.
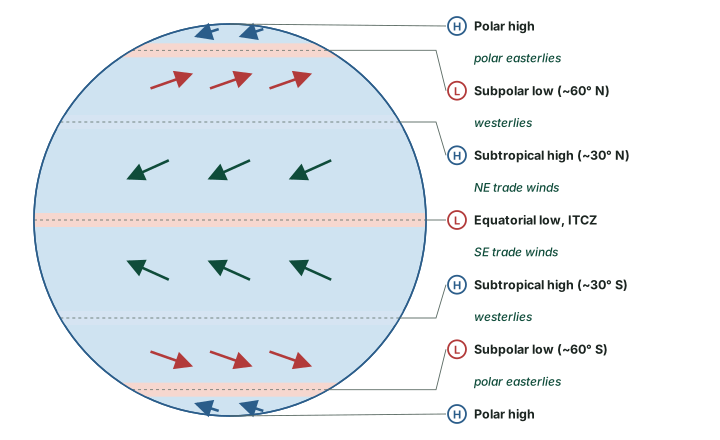
Pressure belts and wind belts (idealised)
| Belt | Near | Air motion | Weather and other names |
|---|---|---|---|
| Equatorial low | the equator | trades converge; air rises | ITCZ cloud band; doldrums (light winds) |
| Trade winds | 0°-30° | surface flow towards the equator | NE trades (N. hemisphere), SE trades (S. hemisphere) |
| Subtropical high | 30° N and S | dry air sinks and warms | horse latitudes: calm, little rain; subtropical deserts |
| Westerlies | 30°-60° | surface flow towards the pole | storm tracks of the middle latitudes |
| Subpolar low | 60° N and S | warm and cold air meet; air rises | polar front |
| Polar easterlies | 60°-90° | outflow from the polar high | cold |
| Polar high | the poles | cold dense air subsides | cold, high pressure |
Source: NCERT, Fundamentals of Physical Geography, Class XI, ch 9 "Atmospheric Circulation and Weather Systems" (Reprint 2026-27); US National Weather Service glossary, "Intertropical convergence zone"; NOAA National Ocean Service, "What are the horse latitudes?"; US NWS Houston/Galveston training slides "Atmospheric Circulations"; R. Stull, Practical Meteorology (Univ. of British Columbia, via LibreTexts), section 11.7.
The belts move with the Sun
"These pressure belts are not permanent in nature," says NCERT. "They oscillate with the apparent movement of the sun. In the northern hemisphere in winter they move southwards and in the summer northwards." The Met Office adds two refinements for the ITCZ: it "follows the migration of the Sun's overhead position typically with a delay of around 1-2 months", and it "tends to move further north and south over land areas than that over water". Large continents heat and cool faster than oceans (see insolation and the heat budget), so they pull the belts further.
NCERT calls the most pronounced result of these shifts the monsoon, "especially over southeast Asia". The Indian monsoon, the role of the shifting ITCZ over India and the jet streams that go with it are taught on page 08, Monsoon Mechanism, Jet Streams and Tropical Cyclones.
East-west circulations
The three cells are north-south loops averaged around the globe. Over the tropical oceans there are also east-west loops along the equator; the best known, over the Pacific, is the Walker circulation. NCERT's account of the Southern Oscillation, the see-saw of pressure between the central Pacific and Australia, and of El Niño belongs with it. Both are taught in full on page 07, El Niño, La Niña and ENSO.
The upper westerlies and Rossby waves
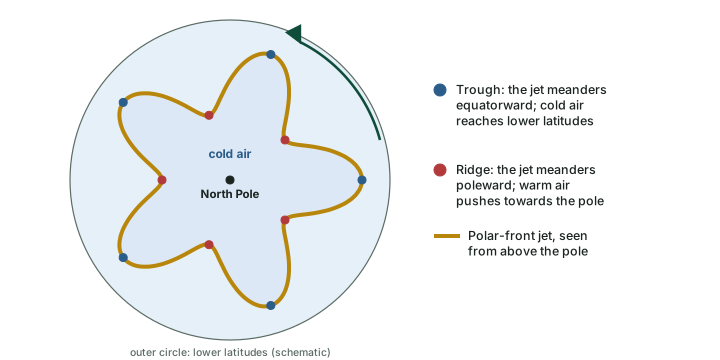
Above the shallow surface belts, the middle and upper troposphere of the middle latitudes is dominated by a broad flow from the west. It does not run in a neat circle. It meanders north and south in long waves called Rossby waves, after C.-G. Rossby, whose 1939 paper with colleagues in the Journal of Marine Research (volume 2, pages 38-55) analysed them. Stull: "Regions near the tropopause where the jet stream meanders equatorward are called troughs", and poleward meanders are called ridges. The waves usually drift eastward.
The waves matter for weather on the ground, because they are bound up with the formation of the cyclones of the middle latitudes (see air masses and fronts). The large pool of cold air that circles each pole aloft is often called the polar vortex; when the westerlies buckle into deep troughs, tongues of that cold air can reach lower latitudes than usual.
Jet streams
The US National Weather Service defines a jet stream as "Relatively strong winds concentrated in a narrow stream in the atmosphere, normally referring to horizontal, high-altitude winds." It adds that general weather patterns are closely related to the position, strength and orientation of the jet, and that a jet at low levels is a low-level jet.
A jet is a thin ribbon. Stull: "Jet vertical thickness (order of 5 to 10 km) is much smaller than their horizontal width (order of 1000 to 2000 km)." Inside it, the fastest part of the wind is not uniform either. A jet streak, in the NWS glossary, is "a point or area ('streak') of relative maximum wind speeds within a jet stream".
Why jets form where they do
Westerly jets grow where the horizontal temperature contrast is sharpest. A strong north-south temperature gradient makes the westerly wind increase with height (the thermal-wind relation), so the fastest winds sit near the tropopause above the zones of sharpest contrast. Stull: the polar-front jet "forms over the polar front — driven by thermal-wind effects due to the strong horizontal temperature contrast across the front."
Two westerly jets in winter
"In the winter hemisphere there are often two strong jet streams of fast west-to-east moving air near the tropopause: the polar jet stream and the subtropical jet stream" (Stull). They differ in almost every respect:
- Subtropical jet (STJ). Centred near 30° in the winter hemisphere; very steady; it meanders north and south a bit; about 10° of latitude wide (about 1,000 km); core near 12 km. Seasonal-average speeds are about 45 m/s over the Atlantic, 55-65 m/s over Africa and the Indian Ocean and 60-80 m/s over the western Pacific. It is driven by outflow from the top of the Hadley cell.
- Polar-front jet (PFJ). Centred near 50-60° in the winter hemisphere; "extremely variable"; it meanders extensively; about 5° wide; core near 9 km; speeds vary widely, 25 to 100 m/s. It forms over the polar front.
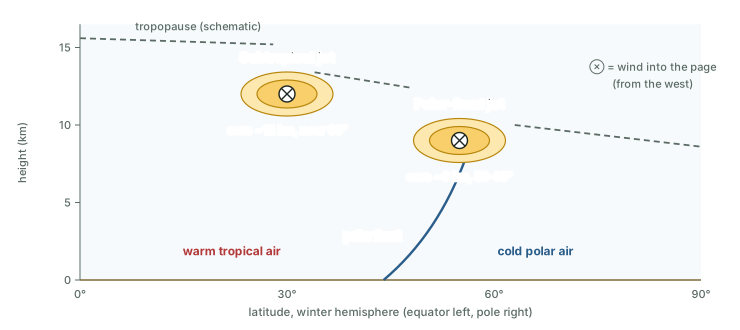
Because the STJ is so steady it shows up clearly in 30-year averages. The PFJ, by contrast, "disappears because it meanders and shifts so extensively that it is washed out by the long-term average" (Stull). In the summer hemisphere the two westerly jets merge, shift poleward to about 40-45° and weaken, because the equator-to-pole temperature contrast is weaker: Stull gives core speeds of 0 to 10 m/s in the northern-hemisphere summer and 5 to 45 m/s in the southern-hemisphere summer. Peak core winds can reach 100 m/s, "although 3-month-average speeds are typically 40 m s-1".
The NOAA NESDIS educational explainer gives rounder figures in miles per hour: jet streams move "at about 110 miles per hour" on average, can reach "250 miles per hour or faster", usually "in polar jet streams in the winter time", and lie "about five to nine miles above Earth's surface".
Worked example: Converting jet speeds
Stull gives jet speeds in metres per second. Convert the subtropical jet over the Atlantic (45 m/s) and the range of the polar-front jet (25-100 m/s) to km/h.
- 1 m/s = 3,600 m per hour = 3.6 km/h.
- Subtropical jet: 45 × 3.6 = 162 km/h.
- Polar-front jet: 25 × 3.6 = 90 km/h; 100 × 3.6 = 360 km/h.
Answer: about 162 km/h for the STJ over the Atlantic; 90-360 km/h for the PFJ (computed).
The tropical easterly jet
Not every jet is westerly. Stull notes that in the summer hemisphere "A weak jet from the east is centered at roughly 10° latitude". Over southern Asia this is the tropical easterly jet (TEJ). A study of it describes the jet as "observed mostly during the ISM that is in the months of June to September", with a maximum "between 50°E-80°E, Equator-15°N and at 150hPa", peaking in July-August. It is a monsoon feature, so its role in the Indian monsoon is taught on page 08, Monsoon Mechanism, Jet Streams and Tropical Cyclones.
The three main jets compared
| Feature | Subtropical jet | Polar-front jet | Tropical easterly jet |
|---|---|---|---|
| Direction | from the west | from the west | from the east |
| Latitude | near 30°, winter hemisphere | near 50-60°, winter hemisphere | about 10° (Stull); equator-15° N over 50-80° E |
| Height | core ~12 km | core ~9 km | ~150 hPa |
| Width | ~10° (~1,000 km) | ~5° | not given |
| Speed | seasonal averages 45-80 m/s by region (162-288 km/h, computed) | 25-100 m/s (90-360 km/h, computed) | "weak" (Stull) |
| Behaviour | very steady; meanders a bit | extremely variable; meanders widely | June-September, peak July-August |
| Cause or setting | outflow from the top of the Hadley cell | temperature contrast across the polar front | a defining feature of the Indian summer monsoon |
Source: R. Stull, Practical Meteorology (Univ. of British Columbia, via LibreTexts), section 11.8; arXiv:1308.0140 (TEJ study, NCEP 1980-2002 average). Speeds in km/h computed as m/s × 3.6.
Is the Hadley circulation widening?
The sinking edge of the Hadley cell sits over the subtropical dry belt, so scientists track whether that edge is moving. The IPCC Sixth Assessment Report states the evidence with care: "there has been a likely widening of the Hadley circulation particularly over the NH, since the 1980s, mostly due to its extension in the NH, although there is only medium confidence in the extent of the changes." Note the three hedges: likely, particularly over the NH, and medium confidence in how far it has moved.
Exam tip
Quote the assessment's own words when you write about Hadley-cell expansion. It is an observed, hedged finding (IPCC AR6 Working Group I, Chapter 2 "Changing State of the Climate System" (2021), section 2.3.1.4.1), not a fixed rate.
Summary
- 1735 Hadley's trade-wind paper
- ~14 km rise at the ITCZ (NCERT)
- 30° / 60° subtropical highs / subpolar lows
- 12 / 9 km STJ / PFJ core heights (Stull)
In one minute
- Heat surplus in the tropics, deficit at the poles: the general circulation moves the difference.
- Three cells: Hadley (0-30°, direct), Ferrel (30-60°, indirect, the average of eddies), polar (60-90°, direct).
- Belts: equatorial low, subtropical highs at 30°, subpolar lows at 60°, polar highs; they follow the Sun.
- Winds: trades, westerlies, polar easterlies; doldrums at the ITCZ, horse latitudes at 30°.
- Jets: thin, fast ribbons near the tropopause; STJ steady near 30°, PFJ variable over the polar front; TEJ easterly in the monsoon season.
- Rossby waves: troughs equatorward, ridges poleward, drifting east.
Sources
Each table and data figure names its source beneath it. The main documents are collected here, with a date where the source carries one. Figures not listed under image credits were drawn for this page from the sources stated in their source lines.
Main sources
| Topic | Source |
|---|---|
| Textbook | NCERT, Fundamentals of Physical Geography, Class XI, ch 9 "Atmospheric Circulation and Weather Systems" (Reprint 2026-27) |
| Hadley's trade-wind paper | George Hadley, "Concerning the cause of the general trade-winds", Philosophical Transactions of the Royal Society, 1735, volume 39, pages 58-62 |
| Rossby waves | C.-G. Rossby and colleagues, Journal of Marine Research, 1939, volume 2, pages 38-55 |
| Cells, upper westerlies, jet streams | R. Stull, Practical Meteorology (Univ. of British Columbia, via LibreTexts), sections 11.7, 11.8 and 11.12 |
| ITCZ and jet streak definitions | US National Weather Service glossary: "Intertropical convergence zone", "jet streak" |
| Horse latitudes | NOAA National Ocean Service, "What are the horse latitudes?" |
| Polar front | US NWS Houston/Galveston training slides "Atmospheric Circulations" |
| Tropical easterly jet | arXiv:1308.0140 (TEJ study, NCEP 1980-2002 average) |
| Hadley-cell widening | IPCC AR6 Working Group I, Chapter 2 "Changing State of the Climate System" (2021), section 2.3.1.4.1 |
| Cell edges and subtropical deserts; jet speeds in miles per hour | Met Office; NOAA NESDIS educational explainer |
Image credits
| Image | Credit and licence |
|---|---|
| All other figures | Drawn for this page from the sources given in their source lines. |