 BharatNotes
Part 8 of 10 of the El Niño and Climate Variability notes. The overview page has the quick revision and exam strategy for all ten parts.
Decadal and Extratropical Modes
ENSO and the Indian Ocean Dipole are not the only rhythms in the climate system. Some modes are slower: the Pacific and the Atlantic have patterns of sea-surface temperature that hold one sign for a decade or more. Others live outside the tropics, as seesaws of air pressure between high and middle latitudes. One lives high above the weather, in the equatorial stratosphere.
This part introduces each of them in the same way: where it is, how long it lasts, who publishes its index and what a positive value means. It ends with what the slow modes do to the faster ones, including the ENSO-monsoon link covered in ENSO, IOD and the Indian monsoon.
From days to decades
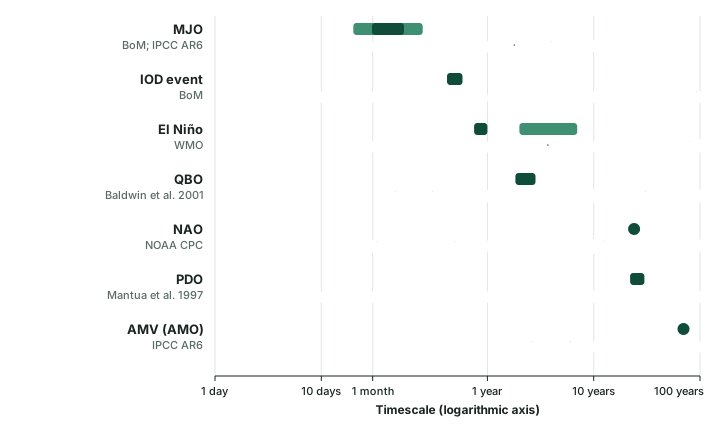
A mode of variability is a pattern that keeps recurring, with the same geography each time but changing sign and strength (see weather, climate and climate variability). The modes in these notes cover a very wide range of timescales. The Madden-Julian Oscillation passes in weeks. In WMO's words, El Niño “typically occurs every two to seven years and lasts around nine to twelve months” (WMO). The Pacific Decadal Oscillation held each sign for 22 and then 30 years between the reversals its discoverers dated (computed), and the Atlantic's slowest pattern has a nominal period of about seventy years.
The chart below sets them on one axis, and two lessons follow. First, a slow mode is always present in the background of a fast one: an El Niño happens during some phase of the PDO and some phase of the AMV. Second, a short record cannot pin down a slow mode. NOAA PSL's AMO series runs from 1856 to January 2023, about 167 years, which holds only 2.4 cycles of a 70-year period (computed).
Each mode is followed through an index, and each index has a publisher. In this part: NOAA's Climate Prediction Center (CPC) for the NAO, the Arctic Oscillation, the Antarctic Oscillation, the PNA and the 30 hPa QBO file; NOAA NCEI for the PDO; the British Antarctic Survey for a station-based SAM index; and NOAA PSL for the AMO, which it no longer updates. Name the publisher with the number, because two bodies can compute different indices for the same mode.
Pacific decadal variability: PDO, IPO and PDV
A pattern found through salmon
The Pacific Decadal Oscillation (PDO) was described in a 1997 paper by Mantua and colleagues in the Bulletin of the American Meteorological Society, 78(6), 1069-1079, on a Pacific climate oscillation and its impacts on salmon production. Its abstract dates reversals of the pattern to around 1925, 1947 and 1977. The name was coined by Hare, one of the co-authors: Hare and Mantua later wrote that the term was “coined in 1997 (Mantua et al. 1997)”, and a University of Washington page credits Hare, “who, with Zhang, discovered the PDO, and who coined the term” (University of Washington). So the year of the name is 1997, the year it first appeared in print.
What the index measures
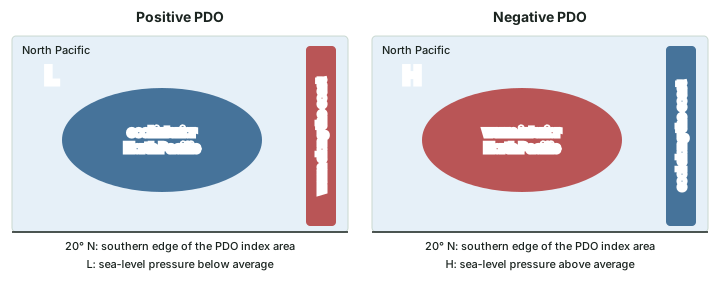
The PDO index is computed from sea-surface temperatures in the Pacific poleward of 20° N (Hare and Mantua, 2001). NOAA's National Centers for Environmental Information (NCEI) publishes it and gives the sign convention: “When SSTs are anomalously cool in the interior North Pacific and warm along the Pacific Coast, and when sea level pressures are below average over the North Pacific, the PDO has a positive value.” NCEI adds that the PDO is often described as “a long-lived El Niño-like pattern of Pacific climate variability” (NOAA NCEI, PDO page).
From PDO to IPO to PDV
The PDO is defined in the North Pacific only. Power and colleagues (1999) described the Interdecadal Pacific Oscillation (IPO). One IPO index (Henley and colleagues, 2015) is a tripole spanning the equatorial, North and South Pacific: the sea-surface temperature of an equatorial box (10° S-10° N, 170° E-90° W) minus the mean of a north box (25-45° N, 140° E-145° W) and a south box (50-15° S, 150° E-160° W).
IPCC AR6 groups all of these under one name, Pacific Decadal Variability (PDV). Its reason is worth remembering: “none of these modes are actually oscillations with clear spectral peaks in the instrumental period” (IPCC AR6 WGI, Annex IV). In other words, the word “oscillation” promises a regular cycle that the record does not show.
AR6 says the PDV's effects on weather far away are “rather similar to those of ENSO but with a longer temporal expression”. In the tropics, a positive PDV goes with warm and dry conditions over the Maritime Continent and the Amazon, and “The Indian and African monsoons also tend to weaken”. The negative phase is “an important cause of droughts in the western and central USA” (all from AR6 WGI Annex IV).
Don't confuse
PDO and ENSO. ENSO is measured in the equatorial Pacific (Niño 3.4; see ENSO indices and forecasts); the PDO index is built from the North Pacific poleward of 20° N. An El Niño lasts about nine to twelve months (WMO); the PDO phases between the reversals Mantua and colleagues found lasted 22 and 30 years (computed). “El Niño-like” describes a resemblance in the pattern, not the same event.
Atlantic modes: AMV and the Atlantic Niño
Atlantic Multi-decadal Variability
The North Atlantic as a whole swings between warmer and cooler decades. The name Atlantic Multidecadal Oscillation (AMO) was introduced by Kerr in 2000. AR6 describes swings in basin-wide sea-surface temperature “with a nominal period in the order of 70 years” and, in the positive phase, warming over the North Atlantic that is strongest, about 0.5 °C, in the subpolar gyre. AR6 uses the name Atlantic Multi-decadal Variability (AMV). One index, following Trenberth and Shea (2006), is North Atlantic sea-surface temperature minus the mean for 60° N-60° S, so that the change shared with the near-global ocean is taken out.
AR6 finds the AMV's influence strongest in the northern summer: it reinforces rainfall in the Sahel and makes the Caribbean wetter through its effect on hurricanes, while north-eastern Brazil, south-eastern South America and the North American Great Plains turn dry. It adds that “the AMV also affects the other monsoon systems with signals found over India, South East Asia and the Maritime Continent” (IPCC AR6 WGI, Annex IV).
Worked example: Checking an AMO claim
A note reads: The AMO is in its warm phase in 2026, according to NOAA. Can you use it in an answer?
- Find the NOAA index. NOAA PSL's AMO page says: “The AMO is currently not updated due to the source dataset (Kaplan SST) not being updated.” Its data run from 1856 to January 2023 (NOAA PSL).
- So a 2026 value cannot come from that index. It would have to come from another dataset, named with its month and value.
- AR6 prefers the AMV, a pattern with a nominal period of about 70 years. One year's value does not by itself show which phase such a slow pattern is in.
Answer: Not as written. Name the dataset, the month and the value, or leave the claim out. The PSL index cannot support any statement about 2026.
The Atlantic Niño and the Atlantic Meridional Mode
AR6 names two dominant modes of the tropical Atlantic, on timescales from a year to a decade. The Atlantic Zonal Mode (AZM), also called the Atlantic Niño, peaks in the northern summer upwelling season, with the largest temperature anomalies in the eastern equatorial Atlantic, and is commonly regarded as the Atlantic counterpart of the Pacific El Niño (Zebiak, 1993, Journal of Climate 6(8), among others). The Atlantic Meridional Mode (AMM) is more active on longer timescales, peaks in the northern spring and shows a temperature gradient across the equator.
Both reach India. AR6 states that “The AZM affects the Indian summer monsoon (ISM), altering the ENSO-ISM connection”: “warm SST in the equatorial Atlantic leads to decreased monsoon rainfall over central India, and the opposite occurs for negative Atlantic SST anomalies via strengthening of the Somali Jet”. For the AMM it notes that “warmer SST over the tropical North Atlantic modulates winds over the western Indian Ocean and may strengthen the monsoon circulation over India” (IPCC AR6 WGI, Annex IV). The word “may” matters: write it as a possibility, not a rule.
Pressure seesaws outside the tropics
The North Atlantic Oscillation (NAO)
AR6 defines the NAO by “alternating (seesaw) variations in SLP between the Azores High in the subtropics and the Icelandic Low in the mid- to high latitudes”. Its positive phase has a strong Azores High together with a deepened Icelandic Low. NOAA's Climate Prediction Center (CPC) draws the pattern as a north-south dipole, with one centre over Greenland and the other across the North Atlantic between 35° N and 40° N (NOAA CPC, NAO).
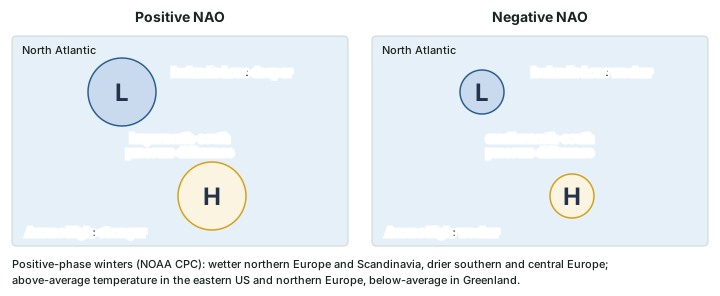
The NAO can hold one phase for a long time. CPC notes that the negative phase dominated from the mid-1950s through the 1978/79 winter, an interval of about 24 years, followed by a positive-phase period from the 1979/80 winter to 1994/95. There is also a tropical trigger: AR6 links phases 2-3 of the Madden-Julian Oscillation with the prevalence of the positive NAO phase, with a lag of 10 to 15 days.
The Arctic Oscillation, or Northern Annular Mode
The Arctic Oscillation (AO) was described by Thompson and Wallace (1998, Geophysical Research Letters 25(9)); it is also called the Northern Annular Mode (NAM). AR6 explains it at two levels: in the stratosphere it corresponds to changes in the strength of the winter polar vortex over the Arctic; in the troposphere, to shifts in the position of the mid-latitude westerly jet stream. Besides its Atlantic centre it has a Pacific centre, weaker, with a slackened Aleutian Low in the positive phase. AR6 notes that NAM and NAO indices are strongly correlated. CPC's AO index uses 1000 mb heights poleward of 20° N and runs from January 1950 (NOAA CPC, AO).
The Southern Annular Mode (SAM)
The Southern Annular Mode, also called the Antarctic Oscillation (AAO), is its southern counterpart. AR6 describes it through the north-south shifts in the position and strength of the mid-latitude westerlies around the hemisphere, and says it is “positive when pressure over Antarctica is anomalously low”.
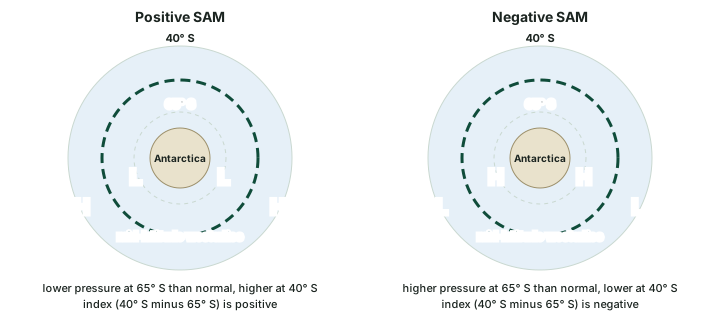
Two indices are in use, and an answer should name the one it means. The British Antarctic Survey index (Marshall, 2003) is the difference between normalised zonal-mean sea-level pressure at 40° S and 65° S, from 12 stations, with a 1971-2000 base, and runs from 1957 (BAS). CPC's AAO index instead uses 700 mb heights poleward of 20° S and starts in January 1979 (NOAA CPC, AAO). AR6 lists the southern-summer effects of a positive SAM: drier conditions over southern Patagonia, wetter conditions in South Africa, Madagascar and south-eastern Australia (where it is also colder), and warmer conditions in New Zealand, Tasmania and the southern tip of South America.
The Pacific-North American pattern (PNA)
The PNA is a pattern of pressure anomalies over the North Pacific and North America (Horel and Wallace, 1981). In its positive phase CPC describes above-average heights near Hawaii and over the intermountain region of North America, and below-average heights south of the Aleutian Islands and over the south-eastern United States. It is closely tied to ENSO: “The positive phase of the PNA pattern tends to be associated with Pacific warm episodes (El Niño), and the negative phase tends to be associated with Pacific cold episodes (La Niña).” (NOAA CPC, PNA). CPC's monthly index runs from 1950.
Don't confuse
NAO and AO. The NAO is a seesaw over the North Atlantic; the AO (NAM) spans the hemisphere and has a weaker Pacific centre as well. AR6 notes that their indices are strongly correlated, but they are built differently. A station NAO index, as AR6 describes it, uses normalised pressure at the Azores (Ponta Delgada) or Iberia (Lisbon or Gibraltar) minus that in the north; CPC's AO index uses 1000 mb heights poleward of 20° N. SAM and AAO are one mode: what differs is the index (BAS station pressure at 40° S and 65° S, or CPC 700 mb heights).
One mode, two names
| Older or common name | Name used in IPCC AR6 | What to know |
|---|---|---|
| Atlantic Multidecadal Oscillation (AMO) | Atlantic Multi-decadal Variability (AMV) | Named AMO by Kerr (2000); NOAA PSL's AMO index is no longer updated |
| Pacific Decadal Oscillation (PDO); Interdecadal Pacific Oscillation (IPO) | Pacific Decadal Variability (PDV) | None shows clear spectral peaks in the instrumental period |
| Arctic Oscillation (AO) | Northern Annular Mode (NAM) | NAM and NAO indices are strongly correlated |
| Antarctic Oscillation (AAO) | Southern Annular Mode (SAM) | The same mode; CPC and BAS compute different indices |
| Atlantic Niño | Atlantic Zonal Mode (AZM) | Commonly regarded as the Atlantic counterpart of El Niño; peaks in the northern summer |
Source: IPCC AR6 WGI Annex IV; NOAA PSL AMO page; NOAA CPC AAO page; British Antarctic Survey.
The Quasi-Biennial Oscillation (QBO)
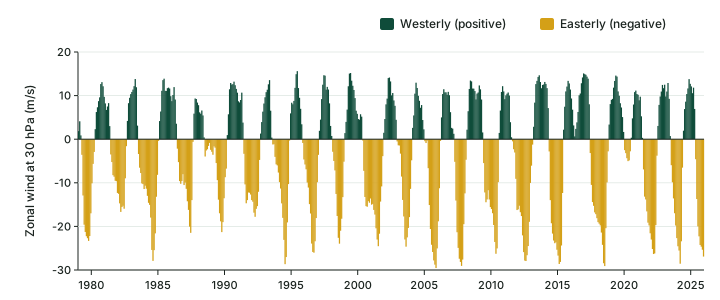
High above the weather, between about 16 and 50 km over the equator, the winds take turns. Easterly and westerly wind regimes alternate and move downward, repeating at intervals of 22 to 34 months, averaging approximately 28 months. The amplitude, about 20 m/s, is nearly constant from 5 to 40 hPa (Baldwin et al., Reviews of Geophysics 39(2), 2001). Because the period is not exactly two years, the name is quasi-biennial.
The review by Baldwin and colleagues states that “Discovery of the QBO must be credited to the independent work of R. J. Reed in the United States and R. A. Ebdon in Great Britain.” Both used balloon (rawinsonde) data from Canton Island. Reed announced the result in January 1960 and it was published as Reed et al. (1961, Journal of Geophysical Research 66); Ebdon published in 1960. The name came later: the review credits Angell and Korshover (1964) with coining it.
The QBO matters beyond the stratosphere. Baldwin and colleagues describe its effect on the breakdown of the wintertime stratospheric polar vortices and on ozone, and say it “may also affect the strength of Atlantic hurricanes”. Keep it apart from the polar vortex itself: the QBO is a wind cycle over the equator, while the vortex sits over the winter pole, and AR6 ties the Arctic one to the Northern Annular Mode.
Remember
Three QBO dates. Announced by Reed in January 1960 and published in 1961; Ebdon also in 1960; named by Angell and Korshover in 1964. Period 22-34 months, averaging approximately 28 (Baldwin et al., 2001).
Exam tip
For any mode, write four things: its region, its timescale, the index and who publishes it, and what a positive value means. The PDO is positive (NCEI index): cool interior North Pacific, warm Pacific coast is a complete statement; the PDO is in a warm phase is not.
How slow modes change faster ones
The modes do not act alone. A slow mode changes the background on which a fast one works, so the same El Niño or IOD can have different effects in different decades. ENSO, IOD and the Indian monsoon shows that not every El Niño year brings an Indian drought. AR6 names the Atlantic Zonal Mode as one mode that alters the ENSO-monsoon connection, and links a positive PDV with a weaker Indian monsoon.
Slow modes that change faster ones
| Mode and phase | What IPCC AR6 Annex IV says | Where India comes in |
|---|---|---|
| PDV, positive | Teleconnections “rather similar to those of ENSO but with a longer temporal expression”; warm and dry Maritime Continent and Amazon | “The Indian and African monsoons also tend to weaken” |
| PDV, negative | “an important cause of droughts in the western and central USA” | No India statement in this passage |
| AMV | Strongest in the northern summer; more Sahel rain, a wetter Caribbean | Signals “found over India, South East Asia and the Maritime Continent” |
| AZM (Atlantic Niño), warm | Alters the ENSO-monsoon connection | Less rain over central India; the opposite when the equatorial Atlantic is cool |
| AMM, warm tropical North Atlantic | Modulates winds over the western Indian Ocean | May strengthen the monsoon circulation over India |
| MJO phases 2-3 (part 6.7) | Prevalence of the positive NAO with a 10- to 15-day lag | Shows a tropical mode reaching the North Atlantic |
Source: IPCC AR6 WGI Annex IV (teleconnection sections for each mode).
Summary
All the modes at a glance
| Mode | Where | Timescale | A positive index means | Index used here |
|---|---|---|---|---|
| NAO | North Atlantic sea-level pressure | One phase dominated about 24 years (CPC) | Strong Azores High, deepened Icelandic Low | NOAA CPC |
| AO / NAM | Northern Hemisphere, surface to stratosphere | Index from January 1950 (CPC) | The hemispheric pattern; slackened Aleutian Low | NOAA CPC (1000 mb) |
| SAM / AAO | Southern extratropics | Index from 1957 (BAS) | Pressure lower than normal over Antarctica | BAS (stations, from 1957); CPC (700 mb, from 1979) |
| PNA | North Pacific and North America | Monthly index from 1950 (CPC) | High near Hawaii and over the intermountain West; low south of the Aleutians | NOAA CPC |
| PDO / PDV | North Pacific poleward of 20° N | Phases of 22 and 30 years (computed) | Cool interior North Pacific, warm Pacific coast, low pressure | NOAA NCEI |
| AMV (AMO) | North Atlantic | Nominal period about 70 years | Warm North Atlantic, most (about 0.5 °C) in the subpolar gyre | AR6 definition; PSL AMO not updated |
| AZM (Atlantic Niño) | Eastern equatorial Atlantic | Interannual to decadal; peaks in the northern summer | Warm eastern equatorial Atlantic | As described in AR6 Annex IV |
| QBO | Equatorial stratosphere, about 16-50 km | 22-34 months | Westerly wind at the chosen level | NOAA CPC and PSL (30 hPa) |
Source: IPCC AR6 WGI Annex IV; NOAA CPC pages for the NAO, AO, AAO and PNA; NOAA NCEI PDO; BAS SAM; Baldwin et al. (2001); Mantua et al. (1997).
- The PDO (Mantua et al., 1997; the name is Hare's) is built from Pacific SSTs poleward of 20° N; its reversals around 1925, 1947 and 1977 give phases of 22 and 30 years (computed). With the IPO it forms AR6's Pacific Decadal Variability.
- The AMV (formerly AMO) has a nominal period of about 70 years (AR6); NOAA PSL's AMO index is no longer updated.
- The Atlantic Niño (AZM) peaks in the northern summer and, per AR6, alters the ENSO-monsoon connection; a warm equatorial Atlantic goes with less rain over central India.
- The NAO, AO/NAM, SAM/AAO and PNA are pressure patterns outside the tropics; CPC ties the positive PNA to El Niño and the negative PNA to La Niña.
- The QBO is a stratospheric wind cycle of 22-34 months (Baldwin et al., 2001), discovered by Reed and by Ebdon (1960-61) and named in 1964. The CPC record gives an average spacing of 27.7 months for 1979-2025 (computed).
Sources
Each table and data figure names its source beneath it. The main documents are collected here, with a date where the source carries one. Figures not listed under image credits were drawn for this page from the sources stated in their source lines.
Main sources
| Topic | Source |
|---|---|
| El Niño's frequency and length | WMO, 2 June 2026 |
| Discovery of the PDO and its reversal years | Mantua et al. (1997), Bulletin of the American Meteorological Society 78(6), 1069-1079 (AMS journal page) |
| Who coined the name PDO | University of Washington; Hare and Mantua (2001) |
| PDO index and sign convention | NOAA NCEI, PDO page |
| IPO | Power and colleagues (1999); Henley and colleagues (2015) |
| PDV, AMV, Atlantic Niño and AMM, NAO, NAM, SAM: definitions and teleconnections | IPCC AR6 WGI Annex IV |
| The AMO name and index | Kerr (2000); Trenberth and Shea (2006); NOAA PSL, AMO |
| The Atlantic Niño | Zebiak (1993), Journal of Climate 6(8) |
| NAO pattern and phase runs | NOAA CPC, NAO |
| Arctic Oscillation | Thompson and Wallace (1998), Geophysical Research Letters 25(9); NOAA CPC, AO |
| SAM indices | Marshall (2003); British Antarctic Survey, SAM; NOAA CPC, AAO |
| PNA | Horel and Wallace (1981); NOAA CPC, PNA |
| QBO: period, discovery and naming | Baldwin et al. (2001), Reviews of Geophysics 39(2); Reed et al. (1961), Journal of Geophysical Research 66; Ebdon (1960); Angell and Korshover (1964) |
| QBO monthly record | NOAA CPC 30 hPa QBO index file (complete years 1979-2025, downloaded November 2026); NOAA PSL QBO page |
Image credits
| Image | Credit and licence |
|---|---|
| All other figures | Drawn for this page from the sources given in their source lines. |