 BharatNotes
Part 7 of 10 of the El Niño and Climate Variability notes. The overview page has the quick revision and exam strategy for all ten parts.
The Madden-Julian Oscillation and Intraseasonal Variability
ENSO and the Indian Ocean Dipole shift the odds for a whole season. Inside any season, rain also comes and goes in spells that last days to weeks. In the tropics the leading mode of such swings, on a scale of weeks, is the Madden-Julian Oscillation (MJO): a vast region of rain clouds and winds that travels east along the equator, followed by a dry region, again and again. This part explains what the MJO is, how it is tracked, and what it does to the Indian monsoon, to cyclones and to ENSO itself.
Discovery and definition
Weather changes over a few days; ENSO changes over seasons and years. In between lies the intraseasonal range: swings that last from a few weeks to a couple of months, inside a single season. The best-known intraseasonal mode is named after the two scientists who found it.
In 1971 Madden and Julian analysed about ten years of upper-air balloon (rawinsonde) records from Canton Island (3°S, 172°W; today Kanton, in Kiribati), in the central Pacific. They found a regular swing in the winds and pressure with a period of 41-53 days (Journal of the Atmospheric Sciences 28(5), 702-708). In 1972 they showed that the swing is made of large circulation cells that move east from the Indian Ocean to the eastern Pacific (Journal of the Atmospheric Sciences 29(6), 1109-1123).
IPCC AR6 now defines the MJO as the "leading mode of tropical intra-seasonal variability with 20–90 days’ time scale". It consists of "planetary-scale disturbances (zonal wavenumber 1–3) of pressure, wind, clouds and rainfall moving predominantly eastward along the equator at average speed of 5 m s–1" (IPCC AR6 WGI Annex IV, section AIV.2.8). "Zonal wavenumber 1–3" means that one to three whole waves fit around the Earth, so each wet or dry region is thousands of kilometres across. Australia's Bureau of Meteorology (BoM) puts it simply: "It circles the globe eastward and repeats about every 30–60 days" (BoM, Madden-Julian Oscillation).
Key idea
The MJO is a travelling pattern of enhanced rain (rising air, tall clouds) and suppressed rain (sinking air, clear skies) that moves east along the equator at about 5 m/s on average and comes round again every month or two. It is the leading mode of intraseasonal variability in the tropics (AR6).
Structure and movement
AR6 describes the MJO as "alternating regions of suppressed and enhanced convection coupled to an anomalous zonal overturning circulation" (IPCC AR6 WGI Annex IV). Convection here means air rising strongly enough to build tall rain clouds. Where convection is enhanced, air converges near the surface, rises and spreads out aloft; it sinks again over the neighbouring regions, where convection is suppressed. The whole set of cells drifts east (diagram below).
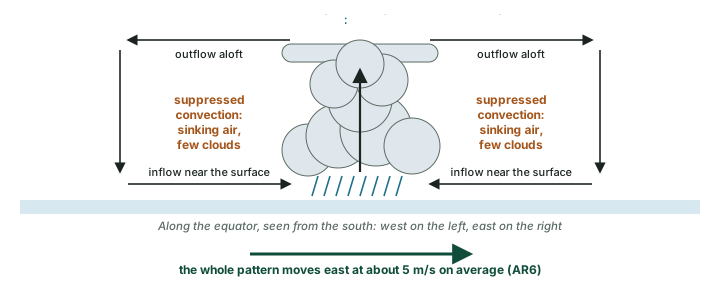
Where does it start and where does it go? AR6: "MJO disturbances are initiated in the equatorial western Indian Ocean and travel eastward mainly over the Indo-Pacific warm pool region". The processes behind it "occur all year round", but its signals are stronger in the northern (boreal) winter: AR6 speaks of "more pronounced signals in boreal winter" (IPCC AR6 WGI Annex IV). In the northern summer the pattern changes, as the section on the MJO and the Indian monsoon below shows.
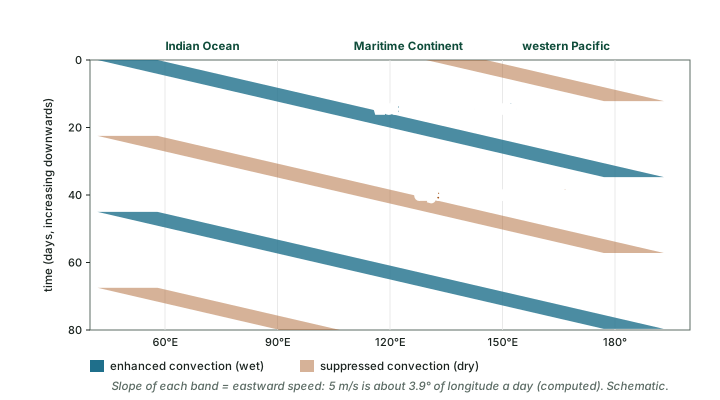
Scientists watch the MJO on a time-longitude diagram (also called a Hovmöller diagram): longitude runs across, time runs down, and each rain band appears as a slanting stripe. The steeper the slant, the slower the movement (diagram below).
Worked example: how fast the MJO travels
AR6 gives the MJO an average eastward speed of 5 m/s. How far does it travel in a day, and roughly how long does it take to cross 50° of longitude along the equator, for example from 70°E to 120°E? Take one degree of longitude at the equator as about 111 km.
- One day = 24 × 60 × 60 = 86,400 seconds.
- Distance in a day = 5 m/s × 86,400 s = 432,000 m ≈ 432 km.
- 50° of longitude ≈ 50 × 111 km = 5,550 km.
- Time = 5,550 ÷ 432 ≈ 12.8 days.
Answer: about 432 km a day, so about 13 days to cross 50° of longitude. That is roughly two RMM phases at their nominal 6-8 days each (see the RMM index below; computed).
Tracking the MJO: the RMM index and its eight phases
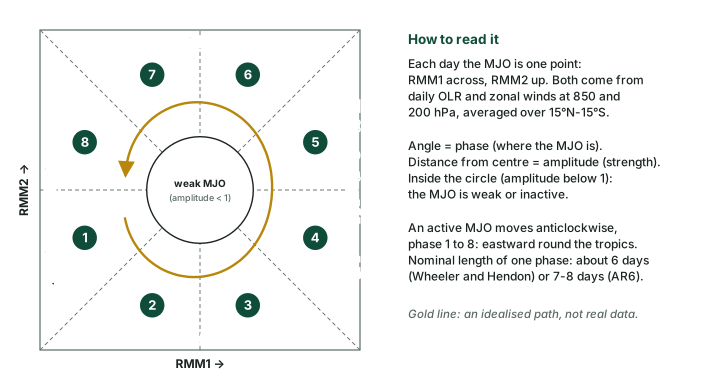
In 2004 Wheeler and Hendon built the index that forecasters still use: the Real-time Multivariate MJO (RMM) index (Monthly Weather Review 132(8), 1917-1932; AMS journal page). As AR6 summarises it, RMM is based on the first two combined EOF modes (the two strongest shared patterns) of daily outgoing longwave radiation (OLR) and of the zonal (east-west) winds at 850 hPa, near the surface, and 200 hPa, high in the troposphere, averaged over 15°N to 15°S. In AR6’s words, "The OLR represents convective activity", while the winds "depict the overturning zonal circulation" (IPCC AR6 WGI Annex IV). BoM explains why: OLR "is often used as a way to identify tall, thick, convective rain clouds" (BoM, MJO monitoring).
The two patterns give two numbers each day, RMM1 and RMM2. Plotted against each other they give the phase diagram below. The angle tells you where the enhanced convection is (the phase, 1 to 8); the distance from the centre tells you how strong it is (the amplitude). AR6 explains that "Each phase has a nominal persistence of about seven to eight days and the anti-clockwise rotation … materializes the propagation of the MJO packets from west to east". Inside the central circle (amplitude below 1) the MJO is "considered to be inactive". Wheeler and Hendon themselves give a nominal phase length of about 6 days; both figures are nominal, and real events run faster or slower.
Where the enhanced convection sits in each RMM phase (northern winter)
| Phase | Location of enhanced convection | Source |
|---|---|---|
| 1 | Growing over Africa and the western Indian Ocean | Wheeler and Hendon 2004 |
| 2 and 3 | Indian Ocean | Wheeler and Hendon 2004 |
| 4 | Maritime Continent; suppressed over the central Pacific, north-east Brazil and equatorial Africa (boreal winter) | AR6 |
| 5 | Shifted south, to about 15°S, as it passes Australia | Wheeler and Hendon 2004 |
| 6 and 7 | Western Pacific; in phase 7, over the Pacific within the westerlies | Wheeler and Hendon 2004 |
| 8 | The reverse of phase 4: central Pacific, north-east Brazil and equatorial Africa wetter (boreal winter) | AR6 |
Source: Wheeler and Hendon (2004), northern-winter composites; IPCC AR6 WGI Annex IV.
Remember
Phase numbers rise from west to east: low numbers over Africa and the Indian Ocean, 4-5 over the Maritime Continent, 6-7 over the western Pacific. An active MJO goes round the diagram anticlockwise, which is eastward on the map.
How long is one cycle?
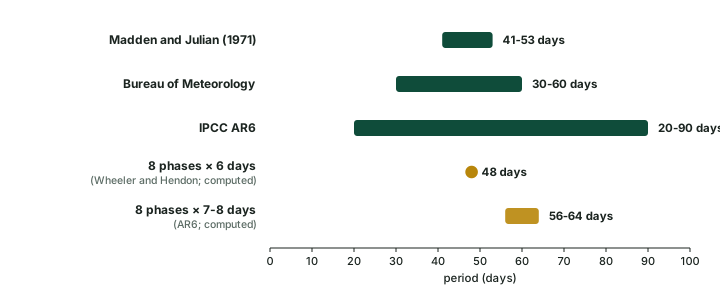
Different sources give different periods, and each is right for what it measures. Madden and Julian found 41-53 days at one station; BoM says the MJO repeats about every 30-60 days; AR6 places it in a 20-90 day band. The phase lengths give another check: eight phases of about 6 days make about 48 days, and eight phases of 7-8 days make 56-64 days (computed). BoM stresses that "no two MJO events, and no two sets of impacts are exactly the same" (BoM, Madden-Julian Oscillation). When you write a period in an answer, name the source.
The MJO around the world
Because the MJO moves a huge source of rain and heat, it changes rainfall far beyond the wet region itself. AR6 gives a clear example for the northern winter: "in phase 4, enhanced rainfall is found over the Maritime Continent while suppression of convection is present over the central Pacific, northeast Brazil and equatorial Africa … The opposite is found during phase 8" (IPCC AR6 WGI Annex IV).
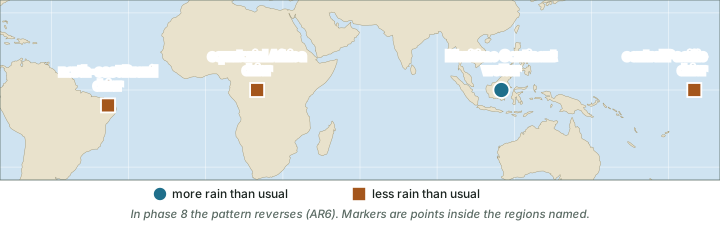
The reach goes further still. AR6 notes that phase 5 contributes to warming in the Arctic, with the opposite in phase 1, and that "Phase 2-3 of the MJO is clearly associated with the prevalence of the positive phase of the NAO with a 10- to 15-day lag": the North Atlantic Oscillation, which governs European winter weather, is described in the part on decadal and extratropical modes. BoM adds that the MJO "influences the timing, development and strength of the major global monsoon patterns. This includes the Indian and Australian monsoons." (BoM, Madden-Julian Oscillation).
This is why forecasters care. AR6 credits MJO forecasts with "predictive skill of up to four weeks", longer than ordinary weather forecasts reach. A strong MJO in a known phase tells a forecaster which regions are likely to turn wetter or drier over the next few weeks.
The MJO and the Indian monsoon
Onset. Wheeler and Hendon (2004) found that the onset of the monsoon over Kerala (India) tends to come when the MJO is in phases 2-3, rather than 6-8, while noting that other influences matter too (Wheeler and Hendon 2004).
Active and break spells. NCERT explains the break this way: "if rain fails to occur for one or more weeks, it is known as break in the monsoon". Over northern India, "rains are likely to fail if the rain-bearing storms are not very frequent along the monsoon trough or the ITCZ over this region"; on the west coast, "dry spells are associated with days when winds blow parallel to the coast" (India: Physical Environment, Class XI, chapter 4 "Climate", 2026 reprint).
Research adds the travelling MJO behind those storms and winds. Pai and colleagues (Climate Dynamics 36, 41-55, 2011) matched Indian monsoon spells to RMM phases. Break spells tend to begin in phases 7, 8, 1 and 2 (about 83 % of breaks; phase 1 alone about 40 %). Active spells tend to begin in phases 3 to 6 (about 70 %; phase 4 alone about 21 %) (Pai et al. 2011).
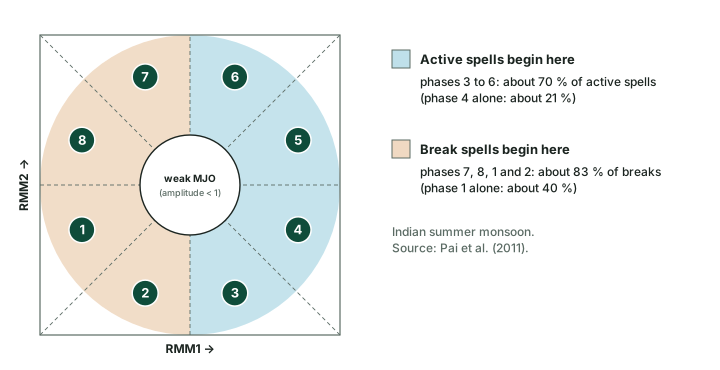
Don't confuse: breaks, NCERT vs the MJO research
NCERT and the research do not disagree; they work at different levels. NCERT describes the weather of a break (few storms along the monsoon trough, winds parallel to the west coast). Pai et al. show when such breaks tend to begin: as the MJO moves into phases 7, 8, 1 and 2. Do not reverse the link: active spells go with phases 3 to 6, breaks with phases 7 to 2. The spells as weather are taught in the BharatNotes page on the monsoon, jet streams and tropical cyclones.
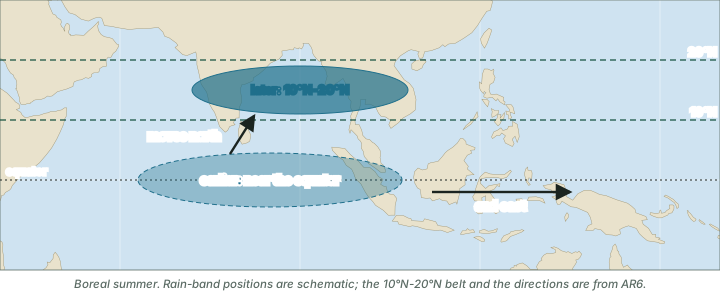
The boreal summer intraseasonal oscillation (BSISO). In the northern summer the MJO's rain centres move off the equator. AR6 says they are "shifted away from the equator" to 10°N-20°N and "propagate northward in the Asian monsoon region", as well as moving east, and calls this the boreal summer intra-seasonal oscillation (BSISO). It adds that "the BSISO tends to prevail during boreal summer, with influences on monsoons, tropical cyclones" (IPCC AR6 WGI Annex IV). For India, this is the form the oscillation takes in the monsoon months (map below).
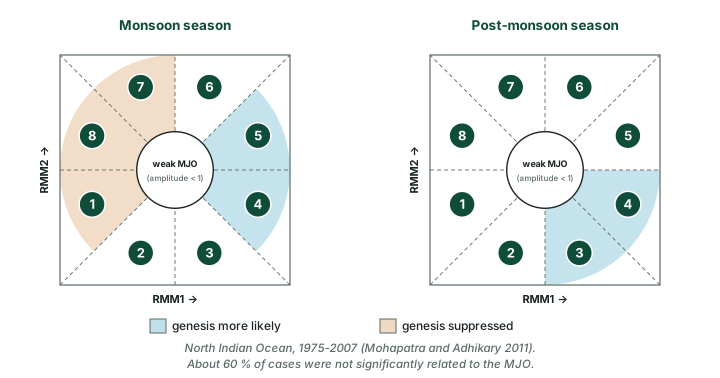
Cyclones. BoM notes that "cyclones are more likely to develop when the MJO is nearby" (BoM, Madden-Julian Oscillation). For the north Indian Ocean (the Bay of Bengal and the Arabian Sea), Mohapatra and Adhikary (Mausam 62(3), 375-390, 2011) studied 1975-2007. Genesis of cyclonic disturbances in the monsoon season was more likely in phases 4-5 and suppressed in phases 1, 7 and 8; in the post-monsoon season it was more likely in phases 3-4. About 60 % of cases, however, were not significantly related to the MJO (Mohapatra and Adhikary 2011). The MJO raises or lowers the odds; it does not decide on its own.
Why it happens
The enhanced phase of the MJO is a region of strong convection and rising air (AR6), and BoM finds that cyclones are "more likely to develop when the MJO is nearby". The suppressed phase is a region of sinking air, where convection is held back.
MJO phases and Indian weather (tendency, not rule)
| What | Phases that favour it | Source |
|---|---|---|
| Monsoon onset over Kerala | Phases 2-3 rather than 6-8; other factors matter too | Wheeler and Hendon 2004 |
| Start of a break spell | Phases 7, 8, 1 and 2 (about 83 %; phase 1 alone about 40 %) | Pai et al. 2011 |
| Start of an active spell | Phases 3 to 6 (about 70 %; phase 4 alone about 21 %) | Pai et al. 2011 |
| Cyclogenesis, monsoon season | More likely in phases 4-5; suppressed in phases 1, 7 and 8 | Mohapatra and Adhikary 2011 |
| Cyclogenesis, post-monsoon season | More likely in phases 3-4 | Mohapatra and Adhikary 2011 |
| Cyclogenesis, both seasons | About 60 % of cases not significantly related to the MJO (1975-2007) | Mohapatra and Adhikary 2011 |
Source: Wheeler and Hendon (2004); Pai et al. (2011); Mohapatra and Adhikary (2011).
Exam tip
A two-week dry spell in a normal monsoon year is not an ENSO event. ENSO and the IOD shift the odds for the whole season (ENSO, IOD and the Indian monsoon); the MJO and the BSISO set the rhythm of wet and dry spells within it. In an answer on monsoon variability, name both time scales.
The MJO and ENSO
The two modes interact. BoM explains: "An MJO can bring periods of weaker trade winds over the Pacific. These can help trigger or strengthen El Niño", and an MJO can likewise weaken or disrupt a La Niña (BoM, Madden-Julian Oscillation). El Niño and La Niña showed that weaker trade winds let warm water slide east, and an MJO passing over the western Pacific can give that slide an extra push.
Don't confuse: MJO vs ENSO
ENSO changes the background state of the tropical Pacific for many months: an El Niño typically develops between March and June and peaks between November and February (WMO). The MJO is a travelling disturbance that crosses the tropics in weeks and repeats about every 30-60 days (BoM). One sets the season's odds; the other sets the weeks' rhythm inside it.
Other waves on the equator
The MJO is not the only travelling disturbance near the equator. BoM's MJO monitoring page describes others that forecasters track alongside it (BoM MJO monitoring):
- Kelvin waves: "alternating low and high pressure centres along the equator that move from west to east".
- Equatorial Rossby (ER) waves: in the most common type, "high and low pressure regions centred at latitudes about 10 degrees north and south of the equator", arranged symmetrically about the equator. They move west.
- Mixed Rossby-gravity (MRG) waves: like equatorial Rossby waves, they "also move towards the west".
The MJO and its relatives
| Disturbance | Moves | Where and what | Source |
|---|---|---|---|
| MJO | East, about 5 m/s on average | Along the equator; wet and dry regions one to three waves around the globe (zonal wavenumber 1-3); 20-90 day band | AR6 |
| BSISO | North, as well as east | Northern summer; rain centres at 10°N-20°N in the Asian monsoon region | AR6 |
| Kelvin wave | West to east | Alternating low and high pressure centres along the equator | BoM |
| Equatorial Rossby wave | West | Pressure centres about 10° north and south of the equator, symmetric about it | BoM |
| Mixed Rossby-gravity wave | West | Like equatorial Rossby waves | BoM |
Source: IPCC AR6 WGI Annex IV; BoM MJO monitoring.
Summary
- The MJO, found by Madden and Julian (1971, 1972), is the leading mode of tropical intraseasonal variability: wet and dry regions moving east at about 5 m/s (AR6).
- Its period depends on the source: 41-53 days (Madden and Julian), about 30-60 days (BoM), a 20-90 day band (AR6).
- The RMM index (Wheeler and Hendon 2004) places it in one of eight phases; it moves anticlockwise on the diagram, eastward on the map; amplitude below 1 means weak or inactive.
- For India: breaks tend to begin in phases 7, 8, 1 and 2, active spells in phases 3 to 6 (Pai et al. 2011); Kerala onset tends to fall in phases 2-3 (Wheeler and Hendon 2004).
- In the northern summer the BSISO carries rain bands north to 10°N-20°N (AR6).
- The MJO can help trigger or strengthen El Niño by weakening the Pacific trade winds for a time (BoM).
Four modes that shape tropical rainfall
| Mode | Where | Rhythm | Part |
|---|---|---|---|
| ENSO | Equatorial Pacific | Develops March-June, peaks November-February; lasts months (WMO) | 6.3-6.5 |
| Indian Ocean Dipole | Tropical Indian Ocean | Starts May-June, peaks August-October (BoM) | 6.6 |
| MJO | Travels east along the equator | Repeats about every 30-60 days (BoM) | 6.7 |
| BSISO | Asian monsoon region, northern summer | Moves north to 10°N-20°N within the season (AR6) | 6.7 |
Source: WMO, 2 June 2026; BoM, Indian Ocean Dipole; BoM, Madden-Julian Oscillation; IPCC AR6 WGI Annex IV.
Sources
Each table and data figure names its source beneath it. The main documents are collected here, with a date where the source carries one. Figures not listed under image credits were drawn for this page from the sources stated in their source lines.
Main sources
| Topic | Source |
|---|---|
| Discovery of the oscillation | Madden and Julian (1971), Journal of the Atmospheric Sciences 28(5), 702-708; Madden and Julian (1972), Journal of the Atmospheric Sciences 29(6), 1109-1123 |
| Definition, structure, speed, RMM summary, teleconnections, forecast skill and the BSISO | IPCC AR6 WGI Annex IV, section AIV.2.8 |
| The MJO's period, its links with monsoons, cyclones and ENSO | BoM, Madden-Julian Oscillation |
| OLR and the other equatorial waves | BoM, MJO monitoring |
| The RMM index, its phases and monsoon onset over Kerala | Wheeler and Hendon (2004), Monthly Weather Review 132(8), 1917-1932 (AMS journal page) |
| Breaks in the monsoon (textbook) | NCERT, India: Physical Environment, Class XI, chapter 4 "Climate" (2026 reprint) |
| Active and break spells by MJO phase | Pai and colleagues, Climate Dynamics 36, 41-55 (2011) (Pai et al. 2011) |
| Cyclogenesis over the north Indian Ocean, 1975-2007 | Mohapatra and Adhikary, Mausam 62(3), 375-390 (2011) (Mohapatra and Adhikary 2011) |
| El Niño's timing | WMO, 2 June 2026 |
| The IOD's timing | BoM, Indian Ocean Dipole |
Image credits
| Image | Credit and licence |
|---|---|
| All other figures | Drawn for this page from the sources given in their source lines. |