 BharatNotes
Part 1 of 10 of the El Niño and Climate Variability notes. The overview page has the quick revision and exam strategy for all ten parts.
Weather, Climate and Climate Variability
Why does one monsoon fail and the next one flood? Why was 2023-24 so much warmer than the years around it? The answer, again and again, is climate variability: the natural swings of the climate around its average, driven by the ocean and the atmosphere pushing on each other. This part sets up the language the rest of these notes use: normals and anomalies, variability and change, internal and forced, modes and teleconnections, and the timescales on which each mode works.
Weather and climate
NCERT draws the first line clearly: "Weather is the momentary state of the atmosphere while climate refers to the average of the weather conditions over a longer period of time" (India: Physical Environment, NCERT Class XI, chapter 4 "Climate" (2026-27 reprint)). Weather is today's rain in Mumbai or this week's heatwave in Rajasthan. Climate is what those places usually get in that month, year after year. Weather changes within hours; a climate statistic changes only slowly.
Climate is more than an average. It also includes how much the weather usually swings about that average, how often extremes occur, and how the seasons run. Two places can share the same average rainfall and still have very different climates if one gets its rain reliably and the other in rare floods.
The climate normal
To say whether a month was "hot" or "dry" we need a fixed yardstick. Meteorologists use the climate normal: the average of a variable over a standard 30-year period. The World Meteorological Organization (WMO) recommends that "the 30-year standard reference periods should be updated every decade", so that normals keep up with a changing climate. WMO's Services Commission recommended that "the new 30-year baseline, 1991-2020, should be adopted globally" in place of 1981-2010 (WMO, "Updated 30-year reference period reflects changing climate" (5 May 2021)). So the current standard normal period is 1991-2020.
Two other baselines stay in use for other purposes. WMO "still recommends the continuation of the 1961-1990 period for the computation and tracking global climate anomalies relative to a fixed and common reference period", and for the Paris Agreement's temperature targets it measures warming against the pre-industrial level, 1850-1900 (same source). Always ask which baseline a number uses: the same month can be "+1.0 °C" against one baseline and less against a later, warmer one.
Remember
- 1991-2020: the current 30-year normal (recommended by WMO's Services Commission); updated every decade.
- 1961-1990: kept for tracking global climate anomalies on a fixed base.
- 1850-1900: the pre-industrial baseline for the Paris Agreement targets.
Anomalies
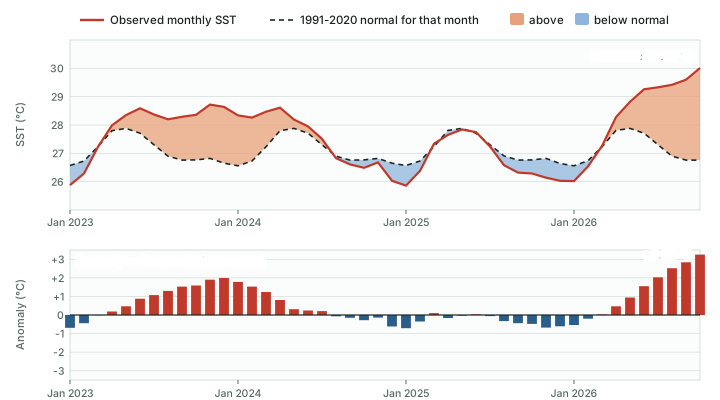
An anomaly is the difference between what was observed and the normal for that place and time of year: anomaly = observed value minus normal. A positive sea-surface temperature (SST) anomaly means warmer than usual for that month; a negative one, cooler. Anomalies remove the ordinary seasonal cycle, so a warm January and a warm July can be compared on equal terms. Every index in these notes, from the Oceanic Niño Index to the Dipole Mode Index, is built from anomalies, as the chart below shows for one region of the Pacific.
Worked example: Finding an anomaly
In October 2026 the average sea-surface temperature of the Niño 3.4 region was 30.01 °C (NOAA CPC monthly file). CPC gives the October 1991-2020 normal for the region implicitly through its anomaly of +3.25 °C. What is the October normal, and what does the anomaly mean?
- Anomaly = observed minus normal, so normal = observed minus anomaly.
- Normal = 30.01 - (+3.25) = 26.76 °C (computed).
- The region was 3.25 °C warmer than its usual October temperature.
Answer: The October normal is about 26.76 °C; the anomaly of +3.25 °C is a monthly Niño 3.4 value (CPC, as of November 2026), not the 3-month Oceanic Niño Index explained in Measuring and Forecasting ENSO.
Climate variability and climate change
Climate variability is the climate's swinging about its mean state, from one season, year or decade to the next, beyond the life of single weather events. A wet monsoon followed by a dry one, a run of warm winters, a decade of strong trade winds: all are variability. Climate change is a lasting shift in the mean state itself, or in its variability, that persists for decades or longer. The present warming is taught on the BharatNotes page Climate Change; these notes are about the swings.
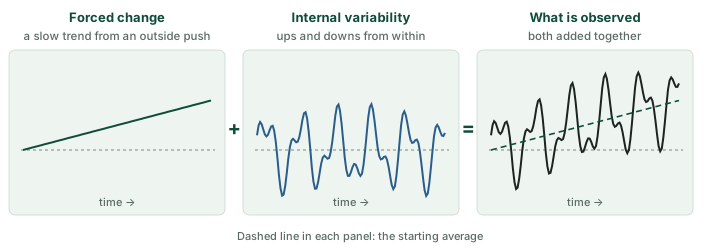
The two are layered. IPCC AR6 describes the modes of variability as acting "on top of externally forced trends" (IPCC AR6 WGI, Annex IV: Modes of Variability (2021)). Over a few years the swings are usually larger than the trend; over decades the trend shows through (see the diagram below). That is why scientists judge a trend from 30-year windows, not from one hot year.
Internal and forced variability
Variability has two kinds of cause.
- Internal variability arises inside the climate system, from the atmosphere, ocean, land and ice interacting with one another. Nothing outside the planet needs to change. El Niño and La Niña are the best-known example on interannual timescales.
- Forced variability is the response to a push from outside the system: changes in the Sun's output, volcanic eruptions that load the stratosphere with particles, or human emissions of greenhouse gases and aerosols.
Don't confuse
- Variability vs change: variability is the swing about the mean; change is a shift of the mean (or of the swings) that lasts decades or longer.
- Internal vs forced: internal variability needs no outside push (ENSO, the IOD, the NAO); forced variability is a response to the Sun, volcanoes or human emissions.
- One El Niño year is variability, not evidence of climate change; a 30-year rise is a trend.
The coupled ocean-atmosphere system
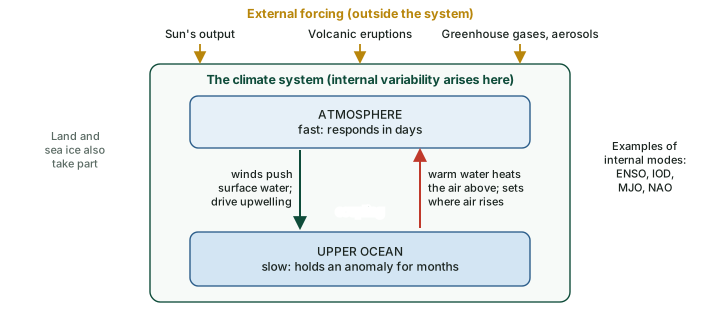
Most of the large swings in these notes come from coupling: the ocean and the atmosphere driving each other. AR6 notes that modes "can arise through the dynamical characteristics of atmospheric circulation, but also through coupling between the ocean and the atmosphere, with some interactions with land surfaces and sea ice" (IPCC AR6 WGI, Annex IV: Modes of Variability (2021)). The loop runs both ways (see the diagram below):
- winds drag the surface water along, pile it up on one side of a basin and pull cold water up from below on the other;
- the sea surface in turn heats and moistens the air above it, and so decides where air rises, where clouds and rain form, and where surface pressure is low.
The two halves work at very different speeds. The atmosphere forgets in days; the upper ocean holds a warm or cold anomaly for months. That slow ocean memory is what makes seasonal forecasts possible: an anomaly in the Pacific in June can still influence the weather of distant regions months later. AR6 notes that "Many modes of variability are driven by internal climate processes and provide a substantial potential source of climate predictability on sub-seasonal to decadal time scales" (IPCC AR6 WGI, Annex IV: Modes of Variability (2021)).
Why it happens
A feedback is a loop in which a change causes effects that return to the change itself. When the ocean and atmosphere reinforce each other (a positive feedback), a small warm patch can grow into a basin-wide event; the part on the tropical Pacific in its normal state explains the best-known example, the Bjerknes feedback. Slower processes in the ocean then reverse the event (see El Niño and La Niña), which is why the swings oscillate rather than run away.
Timescales of variability
Each mode has a typical rhythm, and the chart below places each one on its timescale. The words used for them are simple once broken up:
- Intraseasonal: within a season, from a few weeks to a few months. The Madden-Julian Oscillation (MJO) is the leading example, with a period of 20-90 days in IPCC AR6's range (part 6.7).
- Interannual: from one year to the next. El Niño, the warm phase of ENSO, "typically occurs every two to seven years and lasts around nine to twelve months" (WMO, El Niño press release (2 June 2026)); the Indian Ocean Dipole develops in the northern summer and peaks in autumn (part 6.6). The stratospheric Quasi-Biennial Oscillation (QBO), with an average period of about 28 months, also falls here (part 6.8).
- Decadal: the Pacific Decadal Oscillation (PDO) and the Interdecadal Pacific Oscillation (IPO) tilt the odds for a decade or more at a time (part 6.8).
- Multidecadal: Atlantic Multidecadal Variability (AMV, formerly the AMO), with a nominal period of the order of 70 years, as AR6 gives it (part 6.8).
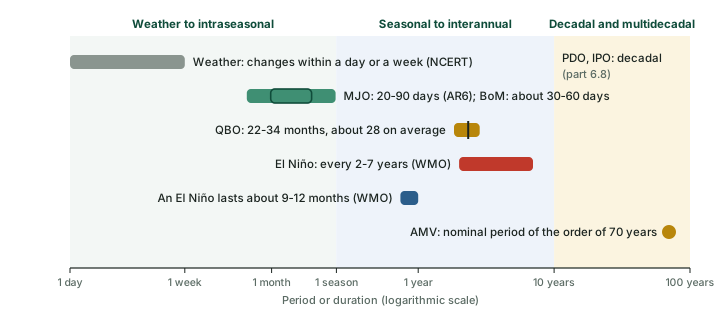
Timescales overlap and interact. A mode on a slow timescale changes the background in which a faster one works: the decadal Pacific state, for example, changes how often El Niño or La Niña occurs and how strongly they act on remote regions, as the part on decadal and extratropical modes discusses. Long records matter for the same reason. AR6 notes that several hundred years of data may be needed to see the full range of ENSO behaviour, which is why scientists use coral, tree-ring and other proxy records as well as instruments.
Modes of variability and teleconnections
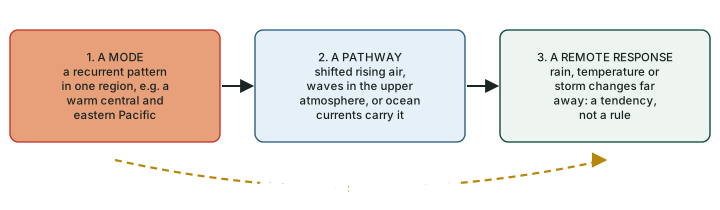
IPCC AR6 gives the definitions these notes use. "Modes are defined as recurrent space-time structures of variability of the climate system with intrinsic spatial patterns, seasonality and time scales." A mode, then, is a pattern that keeps coming back: the same shape on the map, the same favoured season, the same rough rhythm. And "the concept of 'teleconnection' refers to the ability of modes of variability to relate climate in remote regions through associated atmospheric or oceanic pathways" (IPCC AR6 WGI, Annex IV: Modes of Variability (2021)).
A teleconnection is therefore a link at a distance. El Niño warms the central and eastern tropical Pacific, but its effects reach southern Africa, Australia, South America and India because the shifted rising air disturbs the circulation far away (see the diagram below). AR6 sums up the scale: variability on "seasonal-to-multi-decadal time scales, can be described to a large extent by the occurrence and often combination of several modes" (IPCC AR6 WGI, Annex IV: Modes of Variability (2021)). The part on ENSO teleconnections maps ENSO's teleconnections.
Key idea
- A mode is a recurring pattern of variability with its own region, season and rhythm (El Niño-Southern Oscillation, the Indian Ocean Dipole, the NAO).
- A teleconnection is the link through which a mode changes climate in distant regions.
- A teleconnection is a tendency: it shifts the odds of rain or drought, it does not fix the outcome. The part on ENSO, the IOD and the Indian monsoon shows that not every El Niño brought drought to India.
How a mode is measured: indices
A mode is tracked with an index: a single number, usually an anomaly averaged over a defined box of ocean or a pressure difference between two places, published regularly by an agency. The Oceanic Niño Index uses sea temperature in one box of the Pacific; the Southern Oscillation Index uses the pressure difference between Tahiti and Darwin; the NAO index compares pressure near the Azores and Iceland. An index turns a pattern into a number that can be ranked, forecast and compared with rainfall. The same event can look stronger on one index than on another, which is why these notes name the index beside every value.
The modes in these notes
The table below is a map of these notes. Each mode is introduced here only by name, region, rhythm and index; the part given explains how it works and what it does.
The modes of variability in these notes
| Mode | Where | Timescale | Index (publisher) | Part |
|---|---|---|---|---|
| El Niño-Southern Oscillation (ENSO) | Tropical Pacific | Interannual: El Niño recurs every 2-7 years and lasts about 9-12 months (WMO) | Relative ONI (NOAA CPC); SOI (BoM); MEI.v2 (NOAA PSL) | 6.2-6.5, 6.9 |
| Indian Ocean Dipole (IOD) | Tropical Indian Ocean, west vs east | Interannual; develops in northern summer, peaks in autumn | Dipole Mode Index (DMI) | 6.6, 6.9 |
| Indian Ocean Basin mode (IOB) | Whole tropical Indian Ocean (20°S-20°N, 40°E-100°E) | Interannual; matures in northern spring, after the ENSO peak | Basin-average SST anomaly | 6.6 |
| Madden-Julian Oscillation (MJO) | Tropics, moving east along the equator | Intraseasonal: 20-90 days (AR6) | RMM index (Wheeler and Hendon 2004) | 6.7 |
| Boreal Summer Intraseasonal Oscillation (BSISO) | Asian monsoon region, moving north | Intraseasonal, northern summer | BSISO indices | 6.7 |
| Pacific Decadal Oscillation (PDO) | Extratropical North Pacific | Decadal | PDO index (Mantua et al. 1997) | 6.8 |
| Interdecadal Pacific Oscillation (IPO) | Whole Pacific, both hemispheres | Decadal to interdecadal | IPO index | 6.8 |
| Atlantic Multidecadal Variability (AMV, formerly AMO) | North Atlantic | Multidecadal; nominal period of the order of 70 years | North Atlantic SST index | 6.8 |
| North Atlantic Oscillation (NAO) | North Atlantic and Europe | Intraseasonal to multidecadal | Pressure seesaw, Azores High vs Icelandic Low | 6.8 |
| Arctic Oscillation / Northern Annular Mode (AO/NAM) | Northern Hemisphere, mid vs high latitudes | See part 6.8 | AO index (Thompson and Wallace 1998) | 6.8 |
| Southern Annular Mode (SAM, or AAO) | Southern Hemisphere, mid vs high latitudes | See part 6.8 | SAM/AAO index (NOAA CPC) | 6.8 |
| Pacific-North American pattern (PNA) | North Pacific and North America | See part 6.8 | PNA index (NOAA CPC) | 6.8 |
| Quasi-Biennial Oscillation (QBO) | Equatorial stratosphere, about 16-50 km | About 28 months on average (22-34) | 30 hPa equatorial zonal wind | 6.8 |
| Atlantic Niño (Atlantic Zonal Mode) | Eastern equatorial Atlantic | Interannual; peaks in northern summer | Equatorial Atlantic SST anomaly | 6.8 |
Source: IPCC AR6 WGI, Annex IV: Modes of Variability (2021) (definitions, regions, timescales of ENSO, IOD, IOB, MJO/BSISO, PDO/IPO, AMV, NAO, NAM, SAM, Atlantic Niño); ENSO recurrence and duration: WMO, El Niño press release (2 June 2026); QBO: Baldwin, M. P. et al. (2001), "The quasi-biennial oscillation", Reviews of Geophysics 39(2), 179-229, PDF; PNA: NOAA CPC, PNA pattern; SAM: NOAA CPC, Antarctic Oscillation index. "Northern summer" = boreal summer.
Exam tip
- Learn each mode as four facts: where, what pattern, what timescale, which index. Most confusions (PDO vs ENSO, NAO vs AO, IOD vs IOB) are confusions of one of these four.
- The "Southern Oscillation" in ENSO is an atmospheric pressure seesaw across the tropical Pacific; the "Southern Annular Mode" is a different mode of the Southern Hemisphere westerlies.
Summary
- Weather is the state of the atmosphere now; climate is its long-term average and spread.
- The current WMO normal period is 1991-2020; anomalies are departures from such a normal.
- Variability is the swing about the mean; change is a lasting shift. Internal variability needs no outside push; forced variability responds to the Sun, volcanoes or human emissions.
- Ocean-atmosphere coupling and the ocean's slow memory drive the big year-to-year swings and make seasonal forecasts possible.
- A mode is a recurring pattern; a teleconnection is its reach to distant regions, and it is a tendency, not a rule.
Pairs to keep apart
| Term | Means | Contrast with |
|---|---|---|
| Weather | The momentary state of the atmosphere (NCERT) | Climate: the average over a longer period |
| Normal | A 30-year average; now 1991-2020 (WMO) | Anomaly: observed minus normal |
| Climate variability | Swings about the mean, season to decades | Climate change: a lasting shift of the mean |
| Internal variability | Arises within the climate system (ENSO, IOD, NAO) | Forced: response to Sun, volcanoes, emissions |
| Mode | A recurrent pattern with its own region, season and timescale (AR6) | Teleconnection: its link to remote climate |
| Index | One number that tracks a mode | The mode itself, which is a pattern |
Source: India: Physical Environment, NCERT Class XI, chapter 4 "Climate" (2026-27 reprint); WMO, "Updated 30-year reference period reflects changing climate" (5 May 2021); IPCC AR6 WGI, Annex IV: Modes of Variability (2021).
Sources
Each table and data figure names its source beneath it. The main documents are collected here, with a date where the source carries one. Figures not listed under image credits were drawn for this page from the sources stated in their source lines.
Main sources
| Topic | Source |
|---|---|
| Weather and climate | India: Physical Environment, NCERT Class XI, chapter 4 "Climate" (2026-27 reprint) |
| The 1991-2020 normal; the 1961-1990 and 1850-1900 baselines | WMO, "Updated 30-year reference period reflects changing climate" (5 May 2021) |
| Monthly Niño 3.4 SST, its normal and anomaly | NOAA Climate Prediction Center, monthly Niño region SST indices (sstoi.indices), values as of November 2026 |
| Modes of variability, teleconnections, timescales, coupling | IPCC AR6 WGI, Annex IV: Modes of Variability (2021) |
| How often El Niño recurs and how long it lasts | WMO, El Niño press release (2 June 2026) |
| MJO period (30-60 days) | Bureau of Meteorology, Madden-Julian Oscillation |
| Quasi-Biennial Oscillation | Baldwin, M. P. et al. (2001), "The quasi-biennial oscillation", Reviews of Geophysics 39(2), 179-229, PDF |
| Pacific-North American pattern | NOAA CPC, PNA pattern |
| Southern Annular Mode | NOAA CPC, Antarctic Oscillation index |
Image credits
| Image | Credit and licence |
|---|---|
| All other figures | Drawn for this page from the sources given in their source lines. |