 BharatNotes
Part 9 of 10 of the El Niño and Climate Variability notes. The overview page has the quick revision and exam strategy for all ten parts.
ENSO, the IOD and the Indian Monsoon
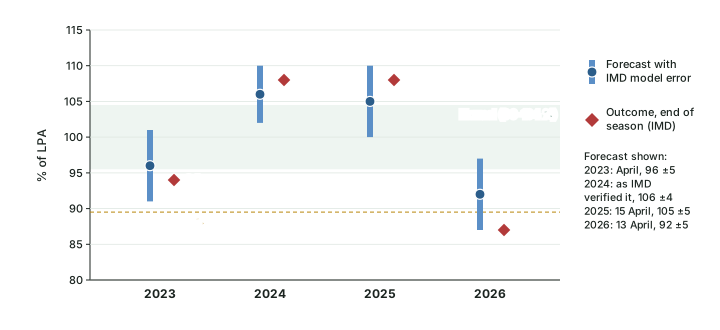
India waits every summer for the southwest monsoon, and every summer the same question is asked: is this an El Niño year? Parts 6.3 and 6.6 described El Niño, La Niña and the Indian Ocean Dipole as modes of the ocean and the atmosphere. This part asks what they do to India. It shows how the India Meteorological Department (IMD) measures a season, what 146 years of rainfall say about El Niño years and drought years, why a positive IOD can cancel part of an El Niño's effect, how IMD builds its seasonal forecast, and how the four seasons from 2023 to 2026 actually turned out.
The monsoon's own machinery (onset, the monsoon trough, depressions, active and break spells) is taught in Monsoon Mechanism, Jet Streams and Tropical Cyclones; this part takes that machinery as given and studies how the oceans tilt it.
Cross-paper relevance
- GS1 (Geography, primary): how IMD measures a monsoon season, El Niño years and drought years, the Indian Ocean Dipole as an offset, La Niña years and IMD's seasonal forecast
- GS3 (Agriculture and economy): the kharif crop's dependence on the monsoon, and El Niño named by the RBI's Monetary Policy Committee in April 2026 as an upside risk to inflation
How IMD measures a monsoon season
IMD judges a season by one number: the rainfall over the country as a whole from June to September, expressed as a percentage of the long period average (LPA), the mean rainfall of those four months over a fixed base period. The base period is now 1971-2020, and the LPA is 87 cm (868.6 mm). IMD first used this value in its long range forecast of 14 April 2022 (IMD press release, 14 April 2022); the normal it replaced, based on 1961-2010, was 880.6 mm. A change of base period changes the yardstick, not the rain: the same season can read slightly differently against two LPAs.
The percentage is then placed in one of five categories. IMD prints the table with each April forecast, and its wording changed between the 2022 and 2026 releases: in 2022 the edges were written 90-96 and 104-110, so 96 and 104 appeared in two classes at once; in 2026 they read 90-95 and 105-110. The chance of each class in an average year (the climatological probability) is the same in both releases.
IMD's five rainfall categories for the all-India June-September season
| Category | 2022 wording (% of LPA) | 2026 wording (% of LPA) | Climatological probability |
|---|---|---|---|
| Deficient | < 90 | < 90 | 16 % |
| Below normal | 90-96 | 90-95 | 17 % |
| Normal | 96-104 | 96-104 | 33 % |
| Above normal | 104-110 | 105-110 | 16 % |
| Excess | > 110 | > 110 | 17 % |
Source: IMD long range forecast press release, 14 April 2022; IMD long range forecast press release, 13 April 2026 (category tables).
Two other scales appear in IMD's reports, and they must not be mixed with the five-category table. For a single region, a single month or the monsoon core zone, IMD's end-of-season reports use three classes with a normal band of 94-106 % of LPA. For each of the 36 meteorological subdivisions, IMD grades departures in wider bands; the Economic Survey 2005-06 printed IMD's subdivision classes as excess (+20 % or more), normal (+19 % to −19 %), deficient (−20 % to −59 %) and scanty (−60 % to −99 %) (Economic Survey 2005-06, ch 8, source IMD).
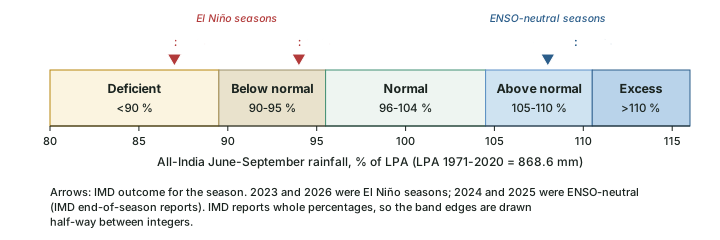
Worked example: Percentage of LPA for the 2026 season
IMD measured 759.4 mm of all-India rainfall from June to September 2026. The LPA (1971-2020) is 868.6 mm. Find the percentage of LPA, the departure and the category.
- Percentage of LPA = 759.4 ÷ 868.6 × 100 = 87.4 %. IMD reports it as 87 %.
- Departure = 87.4 − 100 = −12.6 %, a shortfall of about one-eighth of a normal season.
- On the five-category table, 87 is below 90, so the season is deficient.
- Check with 2023: 820.0 ÷ 868.6 × 100 = 94.4 %, which IMD reported as 94 %.
Answer: 2026: 87 % of LPA, deficient. 2023: 94 % of LPA.
Don't confuse
Percentage of LPA vs departure from a long-term mean. The same season can carry two numbers on two bases. For 2002, IMD's figure, printed in the Economic Survey 2005-06, was 81 % of LPA (a 19 % shortfall against the LPA IMD used then). IITM's rainfall series, measured against its own 1871-2016 mean of 848.1 mm, gives −23.7 %. Neither is wrong; quote the basis with the number.
El Niño years and drought years, 1871-2016
The longest homogeneous record of India's summer rain is the series compiled at the Indian Institute of Tropical Meteorology (IITM), Pune: all-India June-September (JJAS) rainfall for every year from 1871 to 2016, with a mean of 848.1 mm (Kothawale, D.R. and Rajeevan, M. (2017), Monthly, Seasonal and Annual Rainfall Time Series for All-India, Homogeneous Regions and Meteorological Subdivisions: 1871-2016, IITM Research Report RR-138 (ESSO/IITM/STCVP/SR/02(2017)/189), Table 1). IITM's own definition of a drought year is statistical: "During the period 1871-2015, there were 26 major drought years, defined as years with AISMR less than one standard deviation below the mean" (AISMR is all-India summer monsoon rainfall). One standard deviation in this series is about 83 mm, close to 10 % of the mean, so a departure below −10 % picks out the same years. Over the full 1871-2016 record that gives 26 drought years (none in 2016): 1873, 1877, 1899, 1901, 1904, 1905, 1911, 1918, 1920, 1941, 1951, 1965, 1966, 1968, 1972, 1974, 1979, 1982, 1985, 1986, 1987, 2002, 2004, 2009, 2014, 2015.
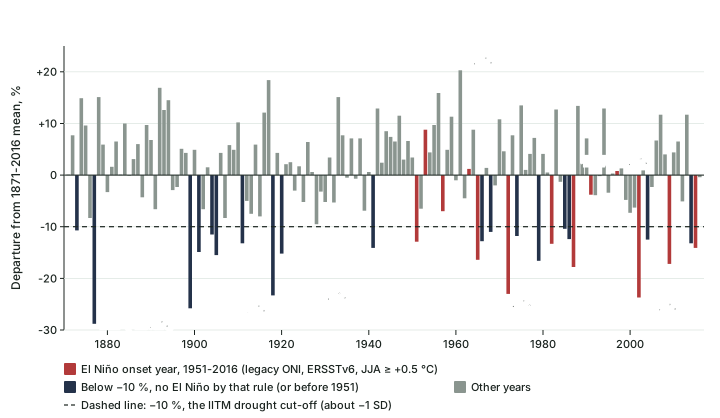
The deepest failure in the record is 1877 (604.0 mm, −28.8 %). Since 1901 the three worst seasons by this measure are 2002 (−23.7 %), 1918 (−23.3 %), 1972 (−23.0 %) (computed). At the other end, the wettest season of the whole series is 1961 (+20.3 %), in a year when the Pacific was neutral (legacy ONI for June-August +0.08 °C).
To compare these years with ENSO, each year from 1951 to 2016 is classified by its June-August legacy ONI (ERSSTv6): a value of +0.5 °C or more marks an El Niño developing during the monsoon, −0.5 °C or less a La Niña. This is a simple rule chosen for these notes, not an official list, and the result is in the table below. Of the 13 El Niño onset years, 8 were droughts. Of the 16 drought years of 1951-2016, 8 came with an El Niño.
El Niño onset years and India's rainfall, 1951-2016
| Year | Legacy ONI (ERSSTv6), JJA, °C | JJAS rainfall, mm | Departure from 1871-2016 mean, % | Drought (below −10 %)? |
|---|---|---|---|---|
| 1951 | +0.71 | 738.8 | −12.9 | Yes |
| 1953 | +0.63 | 922.9 | +8.8 | No |
| 1957 | +0.96 | 788.5 | −7.0 | No |
| 1963 | +0.76 | 857.9 | +1.2 | No |
| 1965 | +1.10 | 709.3 | −16.4 | Yes |
| 1972 | +1.00 | 652.8 | −23.0 | Yes |
| 1982 | +0.78 | 735.4 | −13.3 | Yes |
| 1987 | +1.30 | 697.1 | −17.8 | Yes |
| 1991 | +0.77 | 816.1 | −3.8 | No |
| 1997 | +1.48 | 854.5 | +0.8 | No |
| 2002 | +0.57 | 646.8 | −23.7 | Yes |
| 2009 | +0.50 | 702.0 | −17.2 | Yes |
| 2015 | +1.44 | 728.1 | −14.1 | Yes |
Computed by BharatNotes: El Niño onset year = June-August legacy ONI (ERSSTv6) ≥ +0.5 °C (NOAA CPC oni.ascii.txt, read 18 November 2026); rainfall from Kothawale, D.R. and Rajeevan, M. (2017), Monthly, Seasonal and Annual Rainfall Time Series for All-India, Homogeneous Regions and Meteorological Subdivisions: 1871-2016, IITM Research Report RR-138 (ESSO/IITM/STCVP/SR/02(2017)/189), Table 1. Basis: IITM 1871-2016 mean, not IMD's LPA. Index values as of November 2026; NOAA revises them when datasets change.
A different index gives a slightly different list. On the relative ONI (RONI), NOAA's official index since 1 February 2026 (part 6.4), the same June-August rule drops 2009 (legacy value exactly +0.50) and adds 1968, 1976, 1992, 1994, 2004. Borderline years move; the strong events stay on both lists.
Key idea
Most droughts came with El Niño, but not every El Niño brought drought. In 1951-2016, 8 of 13 El Niño onset years were droughts, and the other 5 (1953, 1957, 1963, 1991, 1997) were not. The most famous exception is 1997: the legacy ONI's June-August value was +1.48 °C and the event went on to peak at +2.37 °C on that index in Nov 1997-Jan 1998 (+2.28 °C on RONI; computed, part 6.3), yet the season ended at +0.8 %, almost exactly normal.
The exceptions run the other way too: droughts with no El Niño by the June-August rule.
Drought years without an El Niño onset, 1951-2016
| Year | Legacy ONI (ERSSTv6), JJA, °C | Departure from 1871-2016 mean, % | Pacific state |
|---|---|---|---|
| 1966 | +0.25 | −12.8 | The year after the 1965 El Niño |
| 1968 | +0.44 | −11.0 | Neutral |
| 1974 | −0.46 | −11.8 | Cool side of neutral, just short of La Niña |
| 1979 | +0.09 | −16.6 | Neutral |
| 1985 | −0.44 | −10.4 | Cool side of neutral |
| 1986 | +0.24 | −12.4 | Neutral |
| 2004 | +0.39 | −12.5 | Borderline: legacy ONI reached +0.54 °C in July-September |
| 2014 | +0.07 | −13.2 | Neutral |
Computed by BharatNotes from Kothawale, D.R. and Rajeevan, M. (2017), Monthly, Seasonal and Annual Rainfall Time Series for All-India, Homogeneous Regions and Meteorological Subdivisions: 1871-2016, IITM Research Report RR-138 (ESSO/IITM/STCVP/SR/02(2017)/189), Table 1 and NOAA CPC legacy ONI (ERSSTv6), read 18 November 2026.
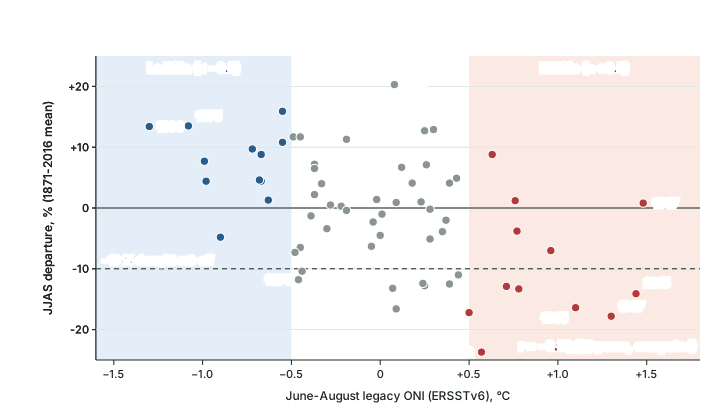
The scatter puts a number on the tendency. Over 1951-2016 the correlation between the June-August legacy ONI and the season's departure is −0.52 (computed here). The sign is negative, as the theory expects: a warmer central Pacific goes with less rain over India. Its size, well short of −1, says that ENSO explains only part of the year-to-year swing; the rest comes from the Indian Ocean, Eurasia, the intraseasonal oscillations of part 6.7 and plain chance.
Exam tip
Learn the pairs that examiners use: 1997 (large El Niño, normal monsoon), 2002 and 2009 (El Niño onset years with deep droughts), 1979 (deep drought, neutral Pacific), and 1961 (the wettest season of 1871-2016, neutral Pacific). Quote the basis with every figure: IITM's 1871-2016 mean or IMD's LPA.
Why El Niño tends to weaken the monsoon, and why the link is loose
Part 6.2 described the Walker circulation: air rises over the warm western Pacific and the Maritime Continent and sinks over the cool east. During El Niño the warm water and the rising branch move east into the central and eastern Pacific (part 6.3). The circulation that goes with this brings anomalous sinking air over the Indian region; Ashok and colleagues (2001) call it the "ENSO-induced" subsidence. Sinking air suppresses the deep convection that monsoon rain depends on, so the season tends to run short.
In 1999 K. Krishna Kumar, B. Rajagopalan and M. A. Cane reported in Science (Science 284: 2156-2159, 25 June 1999) that this link had faded: "Analysis of the 140-year historical record suggests that the inverse relationship between the El Niño–Southern Oscillation (ENSO) and the Indian summer monsoon ... has broken down in recent decades." They offered two reasons: the Walker circulation anomalies that go with ENSO had shifted south-eastward, reducing the subsidence over India, and Eurasian surface temperatures in winter and spring had risen, strengthening the land-sea thermal gradient. In their words, "These observations raise the possibility that the Eurasian warming in recent decades helps to sustain the monsoon rainfall at a normal level despite strong ENSO events."
Hypothesis, not settled fact
The Eurasian-warming explanation was put forward as a possibility, not a proven cause. What the later record shows is plain: after the paper, El Niño onset years 2002 (−23.7 %), 2009 (−17.2 %) and 2015 (−14.1 %) were all droughts in the IITM series, and the El Niño seasons of 2023 (94 % of LPA) and 2026 (87 % of LPA) both ended below normal on IMD's measure. Whether the link weakened for good, or only for a few decades, is still argued; quote Kumar et al. as a 1999 finding.
The Indian Ocean Dipole: the second hand on the monsoon
Part 6.6 introduced the Indian Ocean Dipole (IOD), the east-west seesaw of sea surface temperature across the equatorial Indian Ocean. Its effect on India was first thought to be weak: Saji and colleagues, who described the IOD in 1999, found its correlation with Indian summer monsoon rainfall to be only 0.32. In 2001 Karumuri Ashok, Zhaoyong Guan and Toshio Yamagata (Geophysical Research Letters 28(23): 4499-4502) looked instead at how the IOD changes the ENSO-monsoon relationship, using data for 1958-1997. Their finding: "The IOD plays an important role as a modulator of the Indian monsoon rainfall, and influences the correlation between the ISMR and ENSO ... the ENSO-induced anomalous circulation over the Indian region is either countered or supported by the IOD-induced anomalous meridional circulation cell".
In a positive IOD year, that meridional (north-south) cell brings rising air and convergence over the Bay of Bengal and the Indian subcontinent, which can replace the subsidence an El Niño would otherwise bring. Ashok and colleagues write that a positive IOD "has facilitated normal or excess rainfall" in 1983, 1994 and 1997 "despite the simultaneous occurrence of the negative phase of the Southern Oscillation". They also count 1994 among the years when the IOD event occurred "in the absence of an intense El Niño/La Niña". The pull is not always strong enough. For 1982 the paper finds a stronger El Niño signal (a normalised NINO3 value of 1.7 against 1.4 for the IOD) that "may have caused a deficit"; the IITM series has 1982 at −13.3 %. The two can also pull the same way: for 1992 the paper says "the prevailing negative IOD and El Niño have co-operatively caused an anomalously deficit rainfall". Read that against the record. On the June-August test this part uses, 1992 is an El Niño summer only on RONI (+0.52 °C; legacy ONI +0.35 °C), BoM's event list tags it as a negative IOD year with ENSO neutral (part 6.6), and the IITM series puts the season at −3.9 %, below the mean but not a drought. Of the eleven intense positive IOD events in their 1958-97 sample, eight went with a positive anomaly of Indian summer monsoon rainfall.
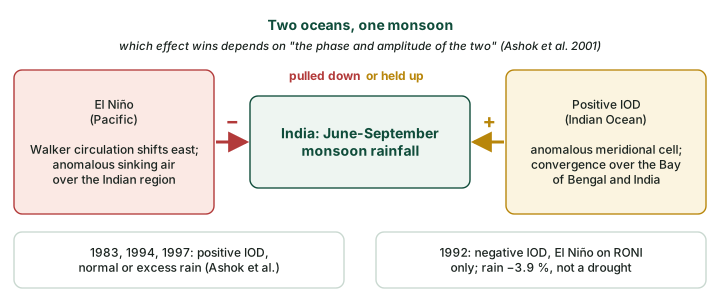
ENSO and IOD combinations named in the sources
| Year | Pacific | Indian Ocean | What the source says about the monsoon |
|---|---|---|---|
| 1983, 1994, 1997 | Negative Southern Oscillation phase; 1994 without an intense El Niño | Positive IOD | "normal or excess rainfall" (Ashok et al. 2001) |
| 1982 | El Niño, stronger (NINO3 1.7, normalised) | Positive IOD, weaker (1.4) | El Niño "may have caused a deficit" (Ashok et al. 2001); IITM −13.3 % |
| 1992 | El Niño on RONI only (JJA +0.52 °C; legacy ONI +0.35 °C) | Negative IOD (BoM: ENSO neutral) | "co-operatively caused an anomalously deficit rainfall" (Ashok et al. 2001); IITM −3.9 %, not a drought |
| 2023 | Weak El Niño from July, moderate in August-September | Neutral until the third week of August, then positive | 94 % of LPA; the IOD "offset this deficiency" (IMD 2023) |
| 2026 | Weak El Niño from June, strong by the season's end | Neutral throughout the season | 87 % of LPA, deficient (IMD 2026) |
Source: Ashok, Guan and Yamagata (2001), GRL 28(23); IMD end-of-season reports 2023 and 2026 (ENSO and IOD rows in IMD's own wording); IITM departures from Kothawale, D.R. and Rajeevan, M. (2017), Monthly, Seasonal and Annual Rainfall Time Series for All-India, Homogeneous Regions and Meteorological Subdivisions: 1871-2016, IITM Research Report RR-138 (ESSO/IITM/STCVP/SR/02(2017)/189), Table 1; JJA index values computed from NOAA CPC RONI and legacy ONI files, read 18 November 2026.
IPCC AR6 sums up the interaction in two words: the IOD and ENSO "often interfere" (IPCC AR6 WGI Annex IV). Two recent years show each side on its own. In 2019 the Bureau of Meteorology recorded "One of the strongest positive Indian Ocean Dipole events on record; El Niño–Southern Oscillation neutral throughout the year" (BoM Annual Climate Statement 2019): a positive IOD with no El Niño at all. In 2023 both were present, and IMD's end-of-season report drew the lesson: "In this El Niño year, India experienced below-average rainfall. Yet, the presence of the IOD during the monsoon's latter phase offset this deficiency, bringing the rainfall anomaly within the standard deviation." (IMD End of Season Report, 30 September 2023).
Remember
The Ashok et al. sample is small, and the paper describes tendencies, not rules. A positive IOD can offset an El Niño; it did not in 1982, and in 2026 no positive IOD arrived in time to help (part 6.10 gives the late-2026 IOD status).
La Niña years
If El Niño tends to weaken the monsoon, La Niña should tend to strengthen it, and the record agrees, with the same caution. By the June-August rule (legacy ONI ≤ −0.5 °C) there were 12 La Niña years in 1951-2016. None was a drought; 4 (1956, 1970, 1975, 1988) were more than 10 % above the mean, and the average departure was +7.5 %. The two strongest La Niña summers in the period, 1988 (legacy ONI −1.30 °C) and 1975 (−1.08 °C), brought +13.4 % and +13.5 %. Yet 1999 ended below the mean, and 1974, on the cool side of neutral at −0.46 °C, was a drought.
A season can also feel La Niña without the ocean crossing the threshold. Of 2024, a year in which the 2023-24 El Niño had ended before the monsoon, IMD wrote: "large-scale atmospheric circulation features were similar to La Nina condition over the equatorial Pacific even though the Sea surface anomaly did not cross the La Nina threshold value (-0.5 Degree)" (IMD, 1 October 2024). The season ended at 108 % of LPA.
Exam tip
"La Niña means a good monsoon" is a tendency. Write "La Niña years have tended to bring normal or above-normal rainfall" and give the evidence: in 1951-2016, 12 La Niña summers, no drought.
How IMD forecasts the monsoon
IMD describes its own system in a press release of 13 April 2026: "Since 2003, India Meteorological Department (IMD) has been issuing the operational long-range forecast (LRF) for the southwest monsoon seasonal (June-September) rainfall averaged over the country in two stages. The first stage forecast is issued in April and the second stage or update forecast is issued by the end of May." In 2021 IMD adopted a new strategy that "uses both dynamical and statistical forecasting system", in which a "Multi-Model Ensemble (MME) forecasting system based on coupled global climate models (CGCMs) from different global climate prediction centres, including IMD's Monsoon Mission Climate Forecast System (MMCFS)" provides the dynamical part (PIB, IMD/MoES release). A coupled model simulates ocean and atmosphere together, which is why the state of the Pacific and the Indian Ocean in spring matters so much.
The April 2026 forecast shows the inputs IMD weighs (IMD, 13 April 2026):
- ENSO: "Weak La Niña‑like conditions are transitioning to ENSO-neutral conditions over the equatorial Pacific", and the MMCFS "suggests the development of El Niño conditions during the SW Monsoon season".
- IOD: neutral, with the models indicating "that the positive IOD conditions are likely to develop towards the end of the southwest monsoon season".
- Snow: Northern Hemisphere snow cover in January-March 2026 "was slightly below normal"; IMD notes that winter and spring snow cover "has a general inverse relationship with the subsequent southwest monsoon seasonal rainfall".
On this basis IMD forecast 92 % of LPA ± 5 %, below normal, and gave the chance of each category. The update of 29 May lowered it to 90 % ± 4 %, and a third forecast on 31 July for August-September also said below normal.
IMD's April 2026 forecast probabilities against climatology
| Category (% of LPA) | Forecast probability, 13 April 2026 | Climatological probability |
|---|---|---|
| Deficient (< 90) | 35 % | 16 % |
| Below normal (90-95) | 31 % | 17 % |
| Normal (96-104) | 27 % | 33 % |
| Above normal (105-110) | 6 % | 16 % |
| Excess (> 110) | 1 % | 17 % |
Source: IMD long range forecast press release, 13 April 2026.
Read the table as IMD intends it: the forecast more than doubled the usual chance of a deficient season (35 % against 16 %), but it still gave a deficient season only about one chance in three. The season did end deficient, at 87 %. IMD's verification judged that "both the first-stage and updated forecasts correctly anticipated below-normal seasonal rainfall over the country as a whole" (IMD, Salient Features 2026), and the outcome, 87 %, did fall inside both forecast ranges, at their low end. Its April input that a positive IOD would develop late in the season did not come true within the season: IMD's own verification records the IOD as neutral throughout.
Don't confuse
A forecast is not an outcome. "IMD forecasts 92 % of LPA" (April 2026) is a probability statement made before the season; "the season was 87 % of LPA" (IMD, end of September 2026) is a measurement. Exam answers should date both.
Farms and prices: a risk stated in advance
A weak monsoon matters beyond meteorology because the summer (kharif) crop depends on it, and food prices follow the harvest. Official bodies therefore write El Niño into their risk statements before the season, not after it. The Reserve Bank of India's Monetary Policy Committee, meeting on 6-8 April 2026, wrote: "Persistently elevated energy prices due to the West Asia conflict and possible El Niño conditions (which could have a negative impact on southwest monsoon) pose upside risks to inflation", and projected CPI inflation for 2026-27 at 4.6 per cent (Resolution of the Monetary Policy Committee, 6-8 April 2026, RBI Bulletin, 23 April 2026).
Remember
The RBI statement is a risk named in April 2026, before the monsoon began. Whether the 2026 El Niño actually lowered kharif output or raised food prices is answered by the official crop estimates and inflation releases that follow the season, not by the forecast.
The seasons of 2023 to 2026
The four most recent seasons make a natural experiment: two El Niño summers and two neutral ones. IMD's end-of-season reports give each outcome and IMD's own reading of the Pacific and the Indian Ocean during the season.
Four monsoon seasons and the two oceans (IMD's outcomes and wording)
| Season | Pacific in season (IMD) | Indian Ocean in season (IMD) | All-India rainfall | East & Northeast India |
|---|---|---|---|---|
| 2023 | Weak El Niño from July, moderate in August-September | IOD neutral until the third week of August, positive thereafter | 820.0 mm, 94 % of LPA: "very close to lower limit of normal rainfall category" | 82 % |
| 2024 | El Niño weakened; neutral ENSO; circulation "similar to La Nina condition" | Neutral IOD | 934.8 mm, 108 %: above normal | 86 % |
| 2025 | Neutral ENSO till September | IOD neutral till July, weak negative IOD towards the end | 937.2 mm, 108 %: above normal | 80 % |
| 2026 | Weak El Niño from June, strong by the end of the season | IOD neutral throughout | 759.4 mm, 87 %: deficient | 74 % |
Source: IMD: End of Season Report, 30 September 2023; IMD press release, 1 October 2024; Salient Features 2025; Salient Features 2026. LPA 1971-2020 = 868.6 mm.
2023 was an El Niño season that did not become a drought. August brought IMD's "record monthly rainfall deficiency (-36% of LPA)", but the positive IOD that developed late in August helped September, and the season closed at 94 % of LPA. IMD described it as "very close to lower limit of normal rainfall category and within the error limit of the forecast". The 94-106 % "normal" band printed in the same report applies to the regions and the monsoon core zone (which received 101 % of LPA), not to the all-India total; on the five-category table, 94 lies just below the normal class. Quote the number and IMD's words, not a bare category.
2024 and 2025 were neutral seasons and both ended at 108 % of LPA, above normal. In both, East and Northeast India was the exception (86 % and 80 %), a reminder that the all-India number hides regional contrasts. The 2025 monsoon reached Kerala on 24 May, its earliest onset since 2009.
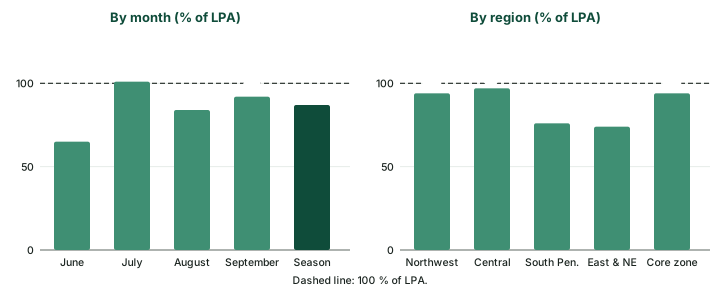
2026 followed the El Niño script. IMD's verification records that "A weak El Nino conditions developed during in June and further strengthen during the SW Monsoon season and a strong El Nino conditions prevailed during end of the season", while "the IOD remained in the neutral phase throughout". The monsoon reached Kerala on 4 June, three days late, and covered the whole country by 9 July. June was the weakest month at 65 % of LPA; July recovered to 101 %; August fell to 84 % and September came in at 92 %. On IMD's monthly bands June and August were below normal, July and September normal.
Latest outcome
The 2026 outcome (IMD, end of September 2026). "Rainfall over the country as a whole during the 2026 southwest monsoon season (June- September) was 87% of its long period average (LPA). All India Summer monsoon rainfall was 759.4 mm which is 4th lowest since 2001 and 13th lowest since 1901." East and Northeast India received about 1,017 mm (1,017.1 mm in the IMD statement, 1,016.3 mm in its Table 1; 74 % of LPA), which IMD called the lowest since 1901; South Peninsula had 76 % of LPA. Of the 36 subdivisions, 18 (53 % of the area) were normal, 17 (42 %) deficient and one, Odisha (5 %), excess. The monsoon core zone received 779.9 mm, just below its normal range of 782.8-881.2 mm.
What NCERT says, and what the record adds
NCERT's India: Physical Environment (Class XI, chapter 4 "Climate", current reprint) closes its El Niño box with two sentences about India: "El-Nino is used in India for forecasting long range monsoon rainfall. In 1990-91, there was a wild El-Nino event and the onset of southwest monsoon was delayed over most parts of the country ranging from five to twelve days." NCERT's Fundamentals of Physical Geography (Class XI, chapter 9, current reprint) says that in strong ENSO years "drought occurs in Australia and sometimes in India".
NCERT and the research record side by side
| Topic | NCERT (Class XI, current reprints) | Research and official record |
|---|---|---|
| ENSO in forecasting | "El-Nino is used in India for forecasting long range monsoon rainfall" | Correct in spirit: IMD's April 2026 forecast weighed the ENSO state and the MMCFS outlook for El Niño, together with the IOD and snow cover (see the forecasting section above). |
| The 1990-91 event | "a wild El-Nino event" with onset "delayed ... from five to twelve days" | "Wild" is NCERT's word, not a strength class. By the legacy ONI rule the event began in 1991 (June-August +0.77 °C); the 1991 season ended at −3.8 % (IITM series), not a drought. The onset delay is NCERT's statement. |
| How often India suffers | drought "sometimes in India" | In 1951-2016, 8 of 13 El Niño onset years were droughts (computed; see the table of El Niño onset years above): "often", with real exceptions. |
Source: NCERT, India: Physical Environment, Class XI, chapter 4, and Fundamentals of Physical Geography, Class XI, chapter 9 (current reprints); computed values from Kothawale, D.R. and Rajeevan, M. (2017), Monthly, Seasonal and Annual Rainfall Time Series for All-India, Homogeneous Regions and Meteorological Subdivisions: 1871-2016, IITM Research Report RR-138 (ESSO/IITM/STCVP/SR/02(2017)/189), Table 1 and NOAA CPC legacy ONI.
Summary
- IMD measures a season as a percentage of the LPA (1971-2020: 868.6 mm) and places it in five categories; regions and months use a 94-106 % normal band.
- IITM's 1871-2016 series has 26 drought years (below −10 %, about −1 SD). In 1951-2016, 8 of 13 El Niño onset years were droughts, and 8 droughts had no El Niño onset.
- El Niño weakens the monsoon through anomalous subsidence over India; Kumar et al. (1999) found the link weaker in recent decades and offered Eurasian warming as a possibility.
- A positive IOD can offset ENSO's pull: Ashok et al. (2001) name 1983, 1994 and 1997 (normal or excess rain despite a negative Southern Oscillation), and IMD says the 2023 IOD "offset this deficiency". Their 1992 case of a negative IOD with El Niño was below the mean (−3.9 %), not a drought.
- IMD forecasts in April and late May with a multi-model ensemble; 2026 was forecast below normal (92 %) and ended deficient (87 %).
Year types and India's rainfall, 1951-2016 (computed)
| Pacific in June-August (legacy ONI, ERSSTv6) | Years | Droughts (below −10 %) | Wet years (above +10 %) | Mean departure, % |
|---|---|---|---|---|
| El Niño onset (≥ +0.5 °C) | 13 | 8 | 0 | −10.7 |
| Neutral | 41 | 8 | 6 | −0.3 |
| La Niña (≤ −0.5 °C) | 12 | 0 | 4 | +7.5 |
Computed by BharatNotes from Kothawale, D.R. and Rajeevan, M. (2017), Monthly, Seasonal and Annual Rainfall Time Series for All-India, Homogeneous Regions and Meteorological Subdivisions: 1871-2016, IITM Research Report RR-138 (ESSO/IITM/STCVP/SR/02(2017)/189), Table 1 (departure from the 1871-2016 mean, not IMD's LPA) and NOAA CPC legacy ONI (ERSSTv6), read 18 November 2026. On RONI, borderline years move between rows (see text).
Sources
Each table and data figure names its source beneath it. The main documents are collected here, with a date where the source carries one. Figures not listed under image credits were drawn for this page from the sources stated in their source lines.
Main sources
| Topic | Source |
|---|---|
| Long period average (1971-2020) and the five rainfall categories | IMD press release, 14 April 2022; IMD long range forecast press release, 13 April 2026 |
| Subdivision rainfall classes | Economic Survey 2005-06, ch 8, source IMD |
| All-India rainfall, 1871-2016 | Kothawale, D.R. and Rajeevan, M. (2017), Monthly, Seasonal and Annual Rainfall Time Series for All-India, Homogeneous Regions and Meteorological Subdivisions: 1871-2016, IITM Research Report RR-138 (ESSO/IITM/STCVP/SR/02(2017)/189), Table 1 |
| IITM's definition of a drought year | IITM |
| ENSO index (legacy ONI, ERSSTv6) | NOAA CPC oni.ascii.txt, read 18 November 2026 |
| The weakening ENSO-monsoon link | K. Krishna Kumar, B. Rajagopalan and M. A. Cane, Science 284: 2156-2159, 25 June 1999 |
| The IOD as a modulator of the monsoon | Karumuri Ashok, Zhaoyong Guan and Toshio Yamagata (2001), Geophysical Research Letters 28(23): 4499-4502 |
| IOD and ENSO "often interfere" | IPCC AR6 WGI Annex IV |
| The 2019 positive IOD | BoM Annual Climate Statement 2019 |
| How IMD forecasts the monsoon | PIB, IMD/MoES release; IMD long range forecast press release, 13 April 2026 |
| The 2023 to 2026 seasons | IMD: End of Season Report, 30 September 2023; press release, 1 October 2024; Salient Features 2025; Salient Features 2026 |
| El Niño as an inflation risk | Resolution of the Monetary Policy Committee, 6-8 April 2026, RBI Bulletin, 23 April 2026 |
| Textbooks | NCERT, India: Physical Environment, Class XI, chapter 4, and Fundamentals of Physical Geography, Class XI, chapter 9 (current reprints) |
Image credits
| Image | Credit and licence |
|---|---|
| All other figures | Drawn for this page from the sources given in their source lines. |