 BharatNotes
Part 6 of 10 of the El Niño and Climate Variability notes. The overview page has the quick revision and exam strategy for all ten parts.
The Indian Ocean Dipole
The Pacific is not the only ocean with a see-saw. In some years the western Indian Ocean turns warmer than usual while the sea off Sumatra turns cooler, and rain follows the warm water: East Africa gets more, Indonesia and Australia less. This is the Indian Ocean Dipole (IOD). It was named only in 1999, it usually lives for a few months around the northern autumn, and it can either soften or sharpen what El Niño does to the Indian monsoon.
A see-saw in the Indian Ocean
Picture the equatorial Indian Ocean as a long bathtub with Africa at one end and Indonesia at the other. In most years the warmest water sits in the east, near Indonesia, and the air above it rises, builds cloud and rains. The Bureau of Meteorology (BoM), Australia's weather agency, describes the normal pattern this way: "Air rises above this area and falls over the western half of the Indian Ocean basin, blowing westerly winds along the equator" (BoM, Indian Ocean Dipole page).
Sometimes the pattern tilts. The east cools, the west warms, and the rain moves west with the warm water. Sometimes it tilts the other way, and even more warm water gathers in the east. BoM defines the Indian Ocean Dipole as these "sustained changes in the difference between sea surface temperatures of the tropical western and eastern Indian Ocean". Like ENSO it is a coupled mode: the ocean and the atmosphere drive each other, so a change in one is locked in by the other.
Discovery, 1999
Two papers appeared side by side in the journal Nature on 23 September 1999 (volume 401), both prompted by the unusual Indian Ocean of 1997-98:
- Saji, Goswami, Vinayachandran and Yamagata, "A dipole mode in the tropical Indian Ocean" (pages 360-363; Nature 401), described "a pattern of internal variability with anomalously low sea surface temperatures off Sumatra and high sea surface temperatures in the western Indian Ocean". They found it independent of ENSO, accounting for about 12 % of the sea surface temperature variability in the Indian Ocean, and causing severe rainfall in eastern Africa and droughts in Indonesia. The name came from the same group (Prof. Yamagata, Dr Saji and colleagues in the Climate Variations Program of the Frontier Research System for Global Change, Japan): "The name IOD is coined by this group" (JAMSTEC IOD FAQ).
- Webster, Moore, Loschnigg and Leben, "Coupled ocean-atmosphere dynamics in the Indian Ocean during 1997-98" (pages 356-360; Nature 401), argued that the 1997-98 anomalies, "in spite of the coincidence with the strong El Niño/Southern Oscillation event", may primarily be "an expression of internal dynamics".
Key idea
The IOD is the Indian Ocean's own coupled ocean-atmosphere see-saw, measured as the difference in sea surface temperature anomaly between a western and an eastern box on the equator. Positive: west warmer than east. Negative: east warmer than west. It is a separate mode from ENSO, though the two often occur together.
Measuring it: the Dipole Mode Index
The index used for the IOD is the Dipole Mode Index (DMI). Take the sea surface temperature (SST) anomaly, the departure from the long-term average for that time of year, averaged over each of two boxes, and subtract the eastern one from the western one (JAMSTEC, Dipole Mode Index; BoM, About the IOD):
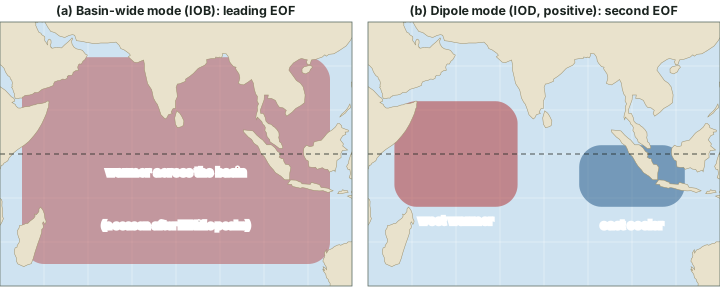
- West pole: 50°E-70°E, 10°S-10°N, the western equatorial Indian Ocean;
- East pole: 90°E-110°E, 10°S-0°, the south-eastern equatorial Indian Ocean off Sumatra (Indonesia).
Both poles straddle or touch the equator. Neither is the Arabian Sea or the Bay of Bengal, which lie well to the north (map below).
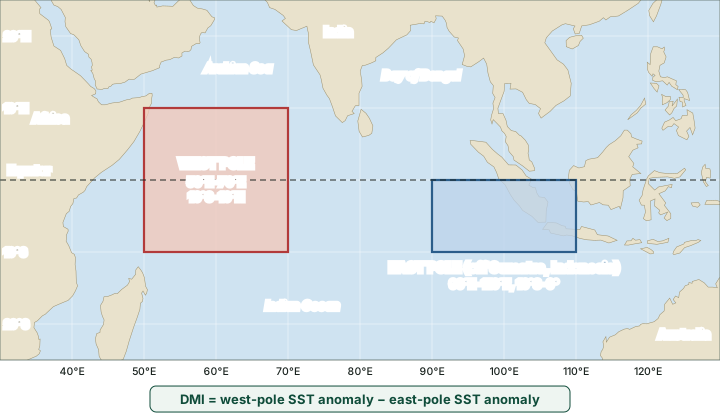
Thresholds. BoM treats an IOD event as under way when the index stays above +0.4 °C (positive) or below -0.4 °C (negative) for a sustained period, not for a single week. JAMSTEC's index page gives no numerical threshold. "Sustained" is the word that matters: in 2026 it made two national agencies describe the same ocean differently (see the section on the IOD in 2026 below).
Worked example: computing the DMI
Illustrative values: in a given month the SST anomaly averaged over the west box is +0.6 °C and over the east box -0.5 °C. What is the DMI, and what does it suggest?
- DMI = west-box anomaly − east-box anomaly.
- DMI = (+0.6) − (−0.5) = +1.1 °C.
- +1.1 °C is above BoM's +0.4 °C threshold, so if values like this persist for weeks, BoM would class it as a positive IOD event.
- Note the subtraction: a warm west alone, or a cool east alone, can each push the index positive.
Answer: DMI = +1.1 °C, a positive-IOD value; one month is not yet an event.
Don't confuse
DMI vs Niño 3.4. The Niño 3.4 index is an anomaly over one box; the DMI is a difference between two boxes. BoM's ±0.4 °C (IOD) vs BoM's ±0.8 °C (relative Niño indices) vs NOAA's ±0.5 °C (relative ONI): three thresholds for three different indices (ENSO indices and forecasts).
Positive and negative phases
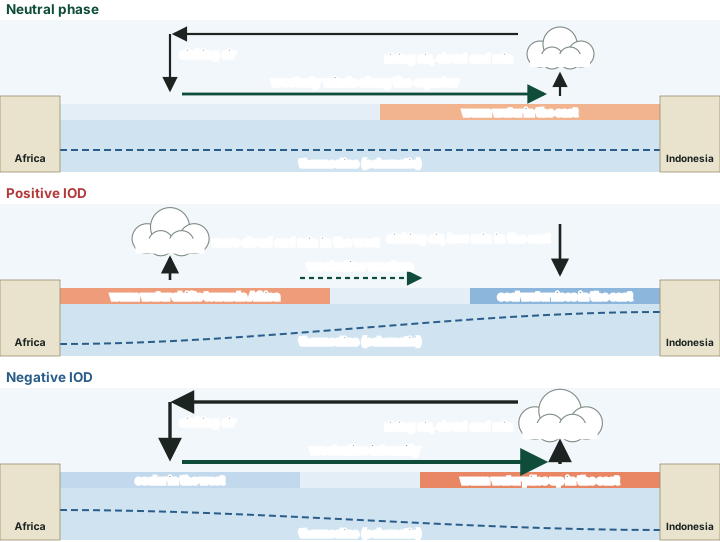
BoM describes the three phases in plain words (BoM, Indian Ocean Dipole):
- Neutral: warm water in the east near Indonesia; air rises there and sinks over the western half of the basin, with westerly winds along the equator.
- Positive IOD: "Westerly winds weaken along the equator allowing warm water to shift towards Africa. Changes in the winds also allow cool water to rise up from the deep ocean in the east." Rainfall tends to rise over eastern Africa and fall over Indonesia (see the impacts section below).
- Negative IOD: "Westerly winds intensify along the equator, allowing warmer waters to concentrate near Australia." The warmer water off north-west Australia supplies more moisture to weather systems crossing the continent.
Why it grows
The IOD grows by the same kind of loop as ENSO (the tropical Pacific in its normal state): a cooler east weakens convection there, the winds along the equator change, more cool water is brought up in the east, and the east cools further. IPCC AR6 notes that such "strong internal feedbacks enable the IOD mode to develop also without influence from ENSO, as noted for some specific events" (IPCC AR6 WGI Annex IV, section AIV.2.4 (Indian Ocean modes)).
The seasonal cycle
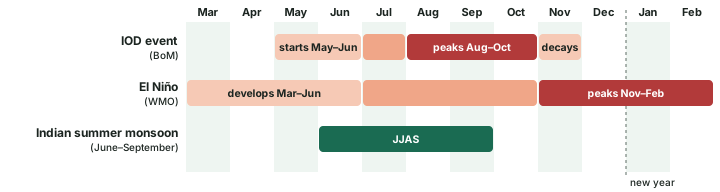
The IOD is tied to the calendar. BoM: "Events usually start around May or June, peak between August and October and then rapidly decay when the monsoon arrives in the southern hemisphere around the end of spring". IPCC AR6 gives the same rhythm: it develops in the boreal summer, reaches its maximum in autumn and ends before winter. That timing matters for India: the IOD grows during the Indian summer monsoon season (June to September) and peaks just before El Niño usually does. WMO says El Niño "generally begins developing between March and June and reaches its peak intensity between November and February" (WMO, 2 June 2026).
Remember
IOD: starts May-June, peaks August-October, gone by about December. El Niño: develops March-June, peaks November-February. So an IOD event lives and dies within one calendar year; an El Niño straddles two.
The record, and which event was "strongest"
Two datasets are used in this part, and they are never mixed in one comparison:
- The DMI from HadISST, published by NOAA's Physical Sciences Laboratory (PSL), monthly from 1870 (NOAA PSL, dmi.had.long.data). The chart below uses its September-November (SON) mean, the season when the IOD peaks. BoM considers IOD values before 1960 less reliable.
- BoM's weekly IOD index, from 2008 (BoM, iod_1.txt). This is the series BoM uses for its current statements.
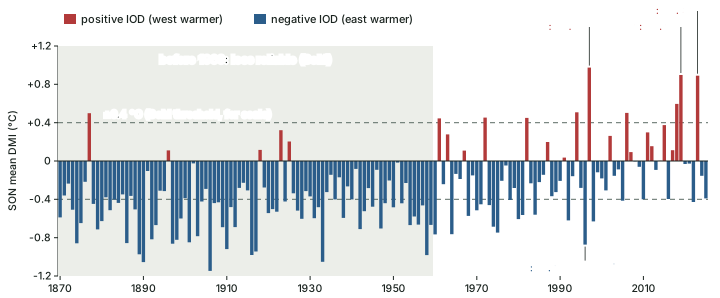
By this measure the highest SON means are 1997 (+0.97 °C), 2019 (+0.90 °C) and 2023 (+0.89 °C), and the lowest since 1960 is 1996 (-0.87 °C) (computed from NOAA PSL HadISST DMI, as of November 2026; NOAA revises values when datasets change).
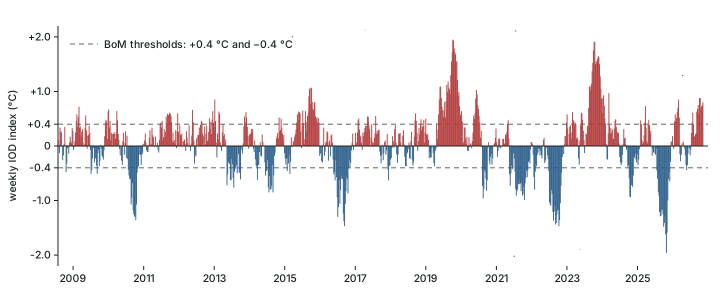
On the weekly index the highest value is +1.95 °C (week ending 13 October 2019); October 2023 reached +1.91 °C in two weeks. The lowest is about -1.9 °C (week ending 2 November 2025), "the most negative value in the Bureau weekly data, which begins in 2008" (BoM, Annual Climate Statement 2025; BoM's statement gave -1.94 °C, and the data file now reads -1.96 °C).
Exam tip: "strongest" needs a dataset
Never write "the strongest IOD on record" without the dataset. On NOAA PSL's HadISST DMI (SON mean), 1997 ranks first. On BoM's weekly index, which starts only in 2008, October 2019 is highest and the 2025 negative event is the most negative. BoM's 2019 statement called that year "One of the strongest positive Indian Ocean Dipole events on record" (BoM, 2019).
BoM's own list of moderate-to-strong events since 1960, "when reliable records of the IOD began", counts nine positive and nine negative events, and tags each with the ENSO state of the same year. Its list stops at 2022. BoM's annual climate statements add the two events since: a "strong positive Indian Ocean Dipole" in 2023, established in early spring together with an El Niño (BoM, 2023), and "A strong negative phase" from late July to early December 2025 (BoM, 2025).
Moderate-to-strong IOD events since 1960, by ENSO state (BoM)
| IOD phase | With El Niño | With La Niña | ENSO-neutral |
|---|---|---|---|
| Positive IOD | 1963, 1972, 1994, 1997, 2006, 2015 | none | 1961, 1967, 2019 |
| Negative IOD | none | 1975, 1998, 2010, 2022 | 1960, 1990, 1992, 1996, 2016 |
Source: BoM, Indian Ocean Dipole history (list to 2022). Later events: BoM Annual Climate Statement 2023 (positive, with El Niño); BoM Annual Climate Statement 2025 (negative).
Notable IOD years in two datasets
| Year | Phase (BoM) | HadISST DMI, SON mean (°C) | BoM weekly index, extreme (°C) | ENSO state (BoM) |
|---|---|---|---|---|
| 1996 | negative | -0.87 | before 2008: no weekly data | neutral |
| 1997 | positive | +0.97 | before 2008: no weekly data | El Niño |
| 2019 | positive | +0.90 | +1.95 (week ending 13 Oct 2019) | neutral |
| 2022 | negative | -0.43 | -1.47 (week ending 16 Oct 2022) | La Niña |
| 2023 | positive | +0.89 | +1.91 (week ending 15 Oct 2023) | El Niño (BoM 2023) |
| 2025 | negative | -0.39 | -1.96 (week ending 2 Nov 2025) | neutral, then weak La Niña from late October (BoM 2025) |
Computed by BharatNotes from NOAA PSL HadISST DMI (SON mean) and BoM weekly IOD index (highest or lowest week of the year), downloaded 18 November 2026. Phase and ENSO state: BoM IOD history, BoM 2023, BoM 2025.
The table shows why datasets must be named. The 2025 event set the weekly record yet has only a modest SON mean on HadISST, because the two series use different SST analyses and averaging periods.
The IOD and ENSO
IPCC AR6 describes two leading patterns of year-to-year SST change in the tropical Indian Ocean (IPCC AR6 WGI Annex IV, section AIV.2.4 (Indian Ocean modes)):
- The Indian Ocean basin-wide mode (IOB), the first EOF (empirical orthogonal function, a pattern extracted statistically from the data): the whole basin warms or cools together, maturing in boreal spring, a season after ENSO peaks. It is mainly a response to ENSO.
- The IOD, the second EOF: the east-west see-saw. It "tends to emerge during ENSO development from boreal summer to autumn", but it can also develop without ENSO through its own feedbacks.
BoM's event list (the first table above) shows the partnership. Every positive IOD that came with ENSO came with El Niño, and every negative IOD that came with ENSO came with La Niña. Yet 1961, 1967 and 2019 were positive IOD years with ENSO neutral: BoM's 2019 statement records a very strong positive IOD with ENSO "neutral throughout the year". AR6 adds a caution for reading any impact: the climate anomalies linked with the IOD "are affected by influences from concomitant ENSO".
Don't confuse
IOD vs ENSO. ENSO lives in the Pacific, peaks November-February and lasts about 9-12 months. The IOD lives in the Indian Ocean, peaks August-October and decays by early summer in the southern hemisphere. They often coincide, but neither is a part of the other. IOD vs IOB. The IOD is an east-west contrast; the IOB is a basin-wide warming or cooling that mostly follows ENSO.
Impacts around the Indian Ocean
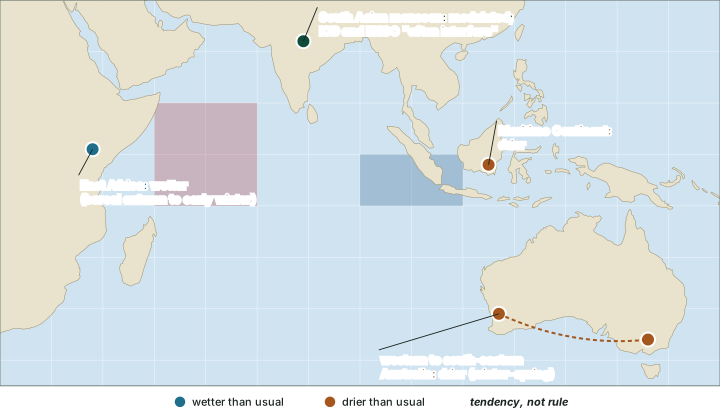
Rain follows the warm water. For a positive IOD, IPCC AR6 records these tendencies (IPCC AR6 WGI Annex IV, section AIV.2.4 (Indian Ocean modes)):
- East Africa: more rain in eastern tropical Africa in boreal autumn to early winter (a negative IOD does the opposite). Saji et al. (1999) linked the mode to "severe rainfall in eastern Africa".
- Indonesia and the Maritime Continent: less rain. A positive IOD and El Niño both reduce rainfall here, so together they reinforce each other.
- Australia: less rain in western to south-eastern Australia, preconditioning the land for fire. BoM: a positive IOD often brings "less rainfall and higher than normal temperatures over parts of Australia during winter and spring"; a negative IOD brings "above-average winter–spring rainfall over parts of southern Australia".
India
The IOD's effect on India is a modulation, not a simple rule. Ashok, Guan and Yamagata (2001) found that "The IOD plays an important role as a modulator of the Indian monsoon rainfall, and influences the correlation between the ISMR and ENSO": the circulation set up by ENSO over India is "either countered or supported" by the one set up by the IOD (Geophysical Research Letters 28(23), 4499-4502). Taken alone, the IOD is only loosely tied to Indian monsoon rainfall: Saji et al. (1999), as Ashok et al. report, found a correlation of only 0.32. IPCC AR6 says the IOD acts on the South Asian summer monsoon directly, through moisture transport over the western Indian Ocean or a modified local Hadley cell, or indirectly through the tropospheric biennial oscillation, and adds that "IOD and ENSO often interfere in their influence on the South Asian summer monsoon".
AR6 also notes a regional pattern for the basin-wide mode: in boreal summer a positive IOB brings more rain over the Western Ghats and Bangladesh and less over the Ganges Delta. The years in which a positive IOD offset El Niño over India, and India's rainfall record, are in ENSO, IOD and the Indian monsoon.
Remember
A positive IOD does not guarantee a good monsoon. It can push against El Niño's drying, or reinforce it when the phases line up the other way (a negative IOD with El Niño). Say "modulates", never "causes".
The IOD in 2026
BoM's weekly index has stayed above +0.4 °C for 10 consecutive weeks, from the week ending 13 September 2026 to the week ending 15 November 2026, when it read +0.80 °C (computed from BoM iod_1.txt, as of mid-November 2026). The two national agencies read this differently.
In the news: one ocean, two verdicts
As of mid-November 2026: BoM's Climate Driver Update of 10 November 2026 states, "A positive Indian Ocean Dipole (IOD) event is underway", and forecasts a return to neutral "in early summer" (Australia's summer; a forecast). IMD's press release of 31 October 2026 states, "The neutral Indian Ocean Dipole (IOD) is currently prevailing", adding that the index "has currently exceeded the positive IOD threshold (+0.4 °C). However, sustained values above this threshold are required before an event is considered established", and that neutral conditions are likely to continue through the post-monsoon season, till December 2026 (a forecast). Both statements were issued during a strong El Niño (El Niño in a warming world gives its status).
The IOD in late 2026: two agencies, two readings
| Agency | Date | What it said | Why they differ |
|---|---|---|---|
| India Meteorological Department (IMD) | 31 October 2026 | "The neutral Indian Ocean Dipole (IOD) is currently prevailing"; threshold exceeded, but not yet sustained | Waits for sustained values before calling an event established |
| Bureau of Meteorology (BoM), Australia | 10 November 2026 | "A positive Indian Ocean Dipole (IOD) event is underway"; weekly index +0.75 °C (week ending 8 November) | Declared an event ten days later, with more weeks above the threshold |
Source: IMD press release, 31 October 2026; BoM Climate Driver Update, 10 November 2026. "Why they differ" is BharatNotes' reading of the two statements.
Positive vs negative IOD at a glance
| Feature | Positive IOD | Negative IOD |
|---|---|---|
| DMI sign | Above +0.4 °C, sustained (BoM) | Below −0.4 °C, sustained (BoM) |
| Sea surface | West warmer, east (off Sumatra) cooler | East warmer (warm water near Australia), west cooler |
| Equatorial westerlies | Weaken | Intensify |
| Rainfall tendency (AR6) | Up over eastern Africa, down over Indonesia | The reverse |
| East Africa (boreal autumn-early winter) | Wetter | Drier |
| Maritime Continent | Drier | Wetter (reverse tendency) |
| Australia (winter-spring) | Drier and warmer over parts | Wetter over parts of southern Australia |
| Usual ENSO partner (BoM list) | El Niño, or ENSO-neutral | La Niña, or ENSO-neutral |
| Examples (BoM) | 1994, 1997, 2006, 2015, 2019, 2023 | 1996, 1998, 2010, 2016, 2022, 2025 |
Compiled from BoM, Indian Ocean Dipole, BoM IOD history, BoM 2023, BoM 2025 and IPCC AR6 WGI Annex IV, section AIV.2.4 (Indian Ocean modes). Tendency, not rule.
Summary
The IOD is a coupled east-west see-saw of the equatorial Indian Ocean, named in 1999. It is measured by the Dipole Mode Index, west box minus east box, with BoM's ±0.4 °C threshold applied to sustained values. It follows the calendar: born in May-June, at its peak in August-October, gone by about December. It often pairs with ENSO, positive with El Niño and negative with La Niña, but it can also arise alone, as in 2019. Its rain follows the warm water: East Africa gains in a positive event, while Indonesia and Australia lose. For India it modulates ENSO's effect rather than ruling the monsoon.
Sources
Each table and data figure names its source beneath it. The main documents are collected here, with a date where the source carries one. Figures not listed under image credits were drawn for this page from the sources stated in their source lines.
Main sources
| Topic | Source |
|---|---|
| The normal pattern, definition, phases, seasonal cycle and impacts on Australia | BoM, Indian Ocean Dipole |
| The two DMI boxes and BoM's threshold | BoM, About the IOD; JAMSTEC, Dipole Mode Index |
| Discovery of the IOD (1999) | Saji, Goswami, Vinayachandran and Yamagata, "A dipole mode in the tropical Indian Ocean", Nature 401, 360-363 (23 September 1999); Webster, Moore, Loschnigg and Leben, "Coupled ocean-atmosphere dynamics in the Indian Ocean during 1997-98", Nature 401, 356-360 (23 September 1999); JAMSTEC IOD FAQ |
| Indian Ocean modes (IOB and IOD), feedbacks and impacts | IPCC AR6 WGI Annex IV, section AIV.2.4 (Indian Ocean modes) |
| The DMI since 1870 | NOAA PSL HadISST Dipole Mode Index, downloaded 18 November 2026 |
| BoM weekly IOD index since 2008 | BoM, iod_1.txt, downloaded 18 November 2026 |
| Moderate-to-strong IOD events since 1960 | BoM, Indian Ocean Dipole history (list to 2022) |
| The 2019, 2023 and 2025 events | BoM Annual Climate Statement 2019; BoM Annual Climate Statement 2023; BoM Annual Climate Statement 2025 |
| The IOD and the Indian monsoon | Ashok, Guan and Yamagata (2001), Geophysical Research Letters 28(23), 4499-4502 |
| El Niño's timing | WMO, 2 June 2026 |
| The IOD in 2026 | IMD press release, 31 October 2026; BoM Climate Driver Update, 10 November 2026 |
Image credits
| Image | Credit and licence |
|---|---|
| All other figures | Drawn for this page from the sources given in their source lines. |