 BharatNotes
Part 10 of 10 of the El Niño and Climate Variability notes. The overview page has the quick revision and exam strategy for all ten parts.
Climate Variability in a Warming World
Every part so far has treated El Niño, La Niña, the Indian Ocean Dipole and the other modes as swings around a fixed average. That average is not fixed. The oceans and the atmosphere are warming, so each swing now happens on a higher floor. This part asks three questions. What do scientists expect the modes themselves to do as the world warms? What did the 2023-24 El Niño do to global temperature? And where does the strong El Niño of 2026 stand, as the agencies that watch it described it up to mid-November 2026?
Two habits run through this part. First, every statement is placed in one of three boxes: an observation (what was measured), a forecast (what is expected in the coming months) or a projection (what models suggest for the coming decades). Second, every number names its index and its date, because one El Niño can carry several different numbers at once.
Cross-paper relevance
- GS1 (Geography, primary): ENSO, the Indian Ocean Dipole and the Madden-Julian Oscillation on a warming background; the 2023-24 El Niño; the 2026 El Niño and the IOD as of mid-November 2026
- GS3 (Environment): climate change: what IPCC AR6 projects for ENSO's rainfall swings, WMO's line on frequency, intensity and impacts, marine heatwaves and the record warm years
Variability on top of a trend
Part 6.1 separated climate variability (swings around the average, many of them internal to the ocean-atmosphere system) from climate change (a lasting shift in the average itself, here forced mainly by greenhouse gases). In a warming world the two are added together. A La Niña year late in a warming record can be warmer than an El Niño year early in it, because the whole curve has moved up. This is why a single hot or cool year says little about the trend, and why the trend says little about any single year.
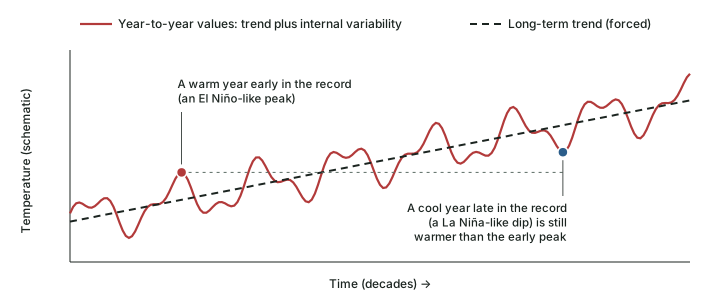
WMO's Secretary-General, Celeste Saulo, put the link between El Niño and global temperature in one line on 8 October 2026: “El Niño doesn't add new heat to the planet. It releases heat the ocean has already been storing beneath the surface - which is why a strong event so often becomes one of the hottest years measured (as with 2024)” (WMO, 8 October 2026). El Niño moves heat from the ocean to the air; the warming trend keeps adding heat to the ocean in the first place.
A rising floor also creates a measurement problem. ENSO indices compare the Niño 3.4 region with an average; if the whole tropical ocean warms, a fixed average makes the region look warmer than normal even when the Pacific's east-west contrast has not changed. From 1 February 2026 NOAA therefore made the relative Oceanic Niño Index (RONI) its official index. NOAA's notice explains that the anomaly is “computed by subtracting the average SST anomaly of the global tropics (20 degrees N to 20 degrees S) from the Niño 3.4 regional anomaly”, and then rescaled to match the amplitude of the traditional index (NWS Public Information Statement 26-05, 13 January 2026). Part 6.4 explains the RONI, the legacy ONI and why they give different peaks; this part uses both, always named.
Key idea
Climate change raises the floor; climate variability swings around it. A relative index such as the RONI measures the swing against the rest of the tropical ocean, so that the rising floor is not mistaken for an El Niño.
What IPCC AR6 projects for ENSO
The Intergovernmental Panel on Climate Change's Sixth Assessment Report (AR6), Working Group I (2021), assesses how the modes may change. It writes its findings in calibrated language, and each word has a fixed meaning. Likely means a probability of 66-100 %; very likely means 90-100 %. Separately, AR6 attaches a level of confidence (low, medium or high) to statements, reflecting how strong and how consistent the evidence is. The words must be copied exactly: “likely” and “very likely” are different findings, and “low confidence” is not the same as “unlikely”.
The size of ENSO's temperature swings: no robust change
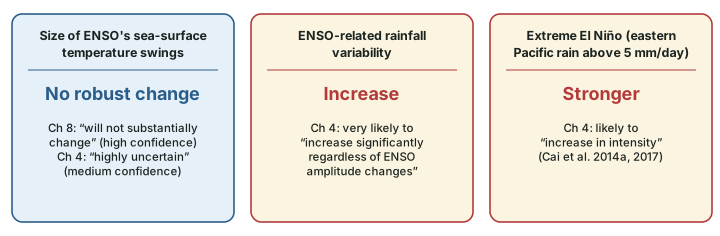
AR6 does not find that global warming will make ENSO's sea-surface temperature (SST) swings bigger or smaller. Chapter 4 of AR6 says “there is no robust model consensus on the forced changes in the amplitude of ENSO SST variability even under the high-emissions scenarios SSP3-7.0 and SSP5-8.5”, and that “the forced change in ENSO SST variability is highly uncertain in CMIP5 and CMIP6 models (medium confidence)”. AR6 Chapter 8 puts the same finding the other way round: “CMIP6 projections indicate that the amplitude of ENSO variability will not substantially change during the 21st century (high confidence)”.
ENSO's rainfall swings: very likely to grow
The rainfall that ENSO moves around is a different matter. AR6 Chapter 4 finds that “it is very likely that ENSO-related rainfall variability will increase significantly regardless of ENSO amplitude changes in the mid- and long-term future”, and that “It is likely that extreme El Niño events, accompanied by the eastern equatorial Pacific rainfall exceeding the 5 mm day–1 rainfall threshold, will increase in intensity (Cai et al., 2014a, 2017)”. An extreme El Niño in this sense is defined by rainfall, not by an SST index: heavy rain spreading into the normally dry eastern equatorial Pacific. AR6 Chapter 8 adds that “the ENSO influence on precipitation over the Indo-Pacific sector is projected to strengthen and shift eastward (medium confidence)”.
Don't confuse
Amplitude of ENSO vs ENSO's rainfall. AR6 Chapter 4 finds “no robust model consensus” on the forced change in the amplitude of ENSO SST variability, which is “highly uncertain” (medium confidence); AR6 Chapter 8 says the amplitude “will not substantially change” (high confidence). Both describe the size of ENSO's SST swings. The “very likely” increase describes ENSO-related rainfall variability. An answer that writes IPCC says El Niño will get stronger has merged the two.
For India, AR6 Chapter 8 reports a mixed picture: “CMIP5 models that realistically reproduce Indian summer monsoon rainfall indicate a strengthening of its relationship with ENSO in RCP8.5 projections, though the response is not consistent for different varieties of ENSO events (Roy et al., 2019). Inconsistent changes in the ENSO-Indian summer monsoon relationship in response to global warming in CMIP5 and CMIP6 models may be related to statistical issues rather than dynamical changes”. In plain words, some models show the El Niño-monsoon link tightening, but the models disagree, and AR6 does not turn this into a confident projection. Part 6.9 shows what the link has looked like in the observed record.
IPCC AR6 WGI statements on the future of the tropical modes
| Topic | AR6 statement (quoted) | Calibrated term | Where in AR6 WGI |
|---|---|---|---|
| ENSO SST amplitude | “the amplitude of ENSO variability will not substantially change during the 21st century” | high confidence | Ch 8, 8.4.2.9.1, p. 1134 |
| ENSO SST amplitude | “the forced change in ENSO SST variability is highly uncertain in CMIP5 and CMIP6 models” | medium confidence | Ch 4, 4.5.3.2, p. 611 |
| ENSO rainfall variability | “ENSO-related rainfall variability will increase significantly regardless of ENSO amplitude changes” | very likely (90-100 %) | Ch 4, p. 611 |
| Extreme El Niño (rainfall-defined) | “will increase in intensity” | likely (66-100 %) | Ch 4, p. 610 |
| ENSO rainfall teleconnection | “projected to strengthen and shift eastward” | medium confidence | Ch 8, p. 1135 |
| Extreme positive IOD | “low confidence that the frequency of extreme positive IOD events will increase under the high-emissions scenario of SSP5-8.5” | low confidence | Ch 4, 4.5.3.3, p. 611 |
| MJO | “The MJO is projected to intensify in a warmer climate, with increased associated precipitation” | medium confidence | Ch 8, p. 1135 |
| Tropical modes in general | “low confidence in how the tropical MoVs will change in the future” | low confidence | Ch 8, p. 1135 |
Source: IPCC (2021), AR6 Working Group I, Chapter 4 and Chapter 8. Likelihood ranges as given in the same report. “MoVs” is AR6's abbreviation for modes of variability.
The IOD and the MJO in a warmer climate
The Indian Ocean Dipole. AR6 Chapter 4 finds that “the forced change in IOD in mid- and long-term future remains uncertain due to limited lines of evidence and its dependence on model mean biases. However, there is low confidence that the frequency of extreme positive IOD events will increase under the high-emissions scenario of SSP5-8.5.” It also notes that “projected climate mean state changes in the tropical Indian Ocean are expected to resemble a positive IOD state, with faster warming in the west compared to the east”. That is a change in the average pattern, not a forecast of more IOD events. AR6 Chapter 8 says that IOD “interactions with ENSO are expected to persist in the future but projected changes in the frequency and intensity of events remain uncertain”, and, citing one study, that “Climate extremes such as those associated with the extreme positive IOD event of 2019 are expected to occur more frequently under continued global warming (Cai et al., 2021)”. The two AR6 chapters are best read together: one study expects more extreme events, while AR6's own assessed statement on extreme positive IOD frequency carries only low confidence. Part 6.6 describes the 2019 event.
The Madden-Julian Oscillation. For the MJO (part 6.7), AR6 Chapter 8 is firmer: “The MJO is projected to intensify in a warmer climate, with increased associated precipitation (medium confidence)”. It notes that sensitivity studies generally project increases in MJO precipitation amplitude in a warmer climate, of up to 14 % per °C of warming. Taking the tropical modes together, though, AR6 states “low confidence in how the tropical MoVs will change in the future”.
Exam tip
When an answer cites IPCC on a mode, carry the calibrated word with the claim: AR6: very likely increase in ENSO-related rainfall variability; AR6: MJO projected to intensify (medium confidence); AR6: low confidence that extreme positive IOD events become more frequent under SSP5-8.5. A projection without its confidence word is a different claim.
WMO's line: frequency and intensity vs impacts
The World Meteorological Organization states the position plainly in its guidance on preparing for El Niño: “There is no evidence that climate change increases the frequency or intensity of El Nino events. But it can amplify associated impacts because a warmer ocean and atmosphere increases the availability of energy and moisture for extreme weather events such as heatwaves and heavy rainfall.” (WMO, Prepare for El Niño). The same page notes that “WMO does not use the term “super El Niño” because it is not part of standardized operational classifications.”
The two halves of WMO's sentence fit AR6's findings described earlier in this part: AR6 projects no robust change in the size of ENSO's SST swings, but a very likely increase in ENSO-related rainfall variability. The event may be no bigger; what it does on land can be.
Don't confuse
More El Niños vs worse El Niño impacts. The claim that climate change is causing more and stronger El Niños is not supported by WMO or by AR6. What WMO does say is that climate change “can amplify associated impacts”. Keep frequency and intensity of the event apart from the size of its impacts. And do not call any event a “super El Niño” in an answer: WMO does not use the term; name the index and value instead (part 6.4).
The 2023-24 El Niño and the record years
The 2023-24 El Niño is the clearest recent case of variability adding to the trend. Its dates, as the agencies recorded them, were:
The 2023-24 El Niño, as the agencies recorded it
| Date | Agency | Statement | Type |
|---|---|---|---|
| 8 June 2023 | NOAA CPC | “El Nino conditions are present and are expected to gradually strengthen into the Northern Hemisphere winter 2023-24” (discussion) | Observation and forecast |
| 4 July 2023 | WMO | “El Nino conditions have developed in the tropical Pacific for the first time in seven years” (press release) | Observation |
| 13 June 2024 | NOAA CPC | “Final El Nino Advisory / La Nina Watch”; ENSO-neutral conditions present (discussion) | Observation |
| 10 January 2025 | WMO | “El Niño, which persisted from mid-2023 to May 2024” (press release) | Observation (looking back) |
Source: NOAA Climate Prediction Center ENSO diagnostic discussions and WMO press releases, linked in each row.
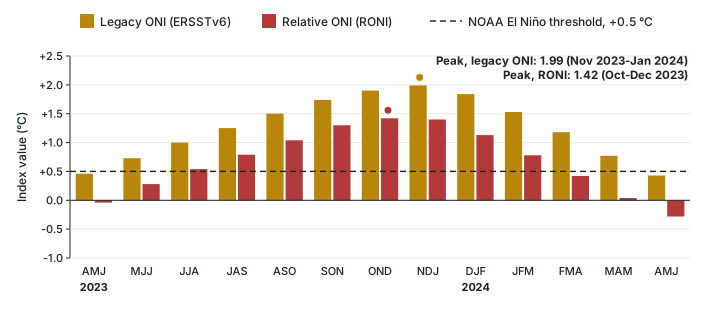
How strong was it? The answer depends on the index (part 6.4). On the RONI the 2023-24 peak was 1.42 °C (Oct-Dec 2023); on the legacy ONI (ERSSTv6) it was 1.99 °C (Nov 2023-Jan 2024), a difference of 0.57 °C (computed). The legacy index compares Niño 3.4 with a fixed base and so includes part of the general warming of the tropical ocean; the RONI removes it.
WMO expected the temperature effect to lag. Declaring the onset on 4 July 2023, it said: “The effect on global temperatures usually plays out in the year after its development and so will likely be most apparent in 2024.” In the event, both years set records in WMO's consolidated datasets. For 2023, WMO wrote that “The shift from La Niña to El Niño conditions in the middle of 2023 contributed to the rapid rise in temperature from 2022 to 2023” (WMO, 19 March 2024). For 2024, it found that the world had “likely just experienced the first calendar year with a global mean temperature of more than 1.5°C above the 1850-1900 average” (WMO, 10 January 2025), while adding that this does “NOT mean that we have failed to meet Paris Agreement long-term temperature goals, which are measured over decades rather than an individual year”.
Global mean near-surface temperature in selected years, as WMO reported it
| Year | Above the 1850-1900 average | RONI in DJF / JJA / OND of that year (computed) | WMO's description |
|---|---|---|---|
| 2016 | 1.29 ± 0.12 °C | +2.14 / −0.70 / −0.96 | One of the “previous warmest years”, with 2020 |
| 2020 | 1.27 ± 0.13 °C | +0.14 / −0.76 / −1.46 | One of the “previous warmest years”, with 2016 |
| 2023 | 1.45 ± 0.12 °C | −0.86 / +0.54 / +1.42 | “warmest year in the 174-year observational record” |
| 2024 | 1.55 ± 0.13 °C | +1.13 / −0.49 / −0.88 | “warmest year on record”; first calendar year likely above 1.5 °C |
| 2025 | 1.43 ± 0.13 °C | −1.10 / −0.41 / −0.98 | 2nd or 3rd warmest year on record |
Source: WMO, 19 March 2024 (2016, 2020, 2023); WMO, 10 January 2025 (2024); WMO State of the Climate 2025 (2025). Values are WMO's consolidated means with their margins of uncertainty. RONI values computed from the NOAA CPC RONI data file; Index values as of November 2026; NOAA revises them when datasets change.
The records themselves, and how WMO combines its datasets, are taught on the Climate Change page. Part 6.5 explains the global temperature link of El Niño years.
Remember
El Niño developed in mid-2023; WMO said its effect on global temperature “usually plays out in the year after its development”. Year of onset, year of peak index and year of peak global temperature are three separate facts. Write each with its own date.
Marine heatwaves
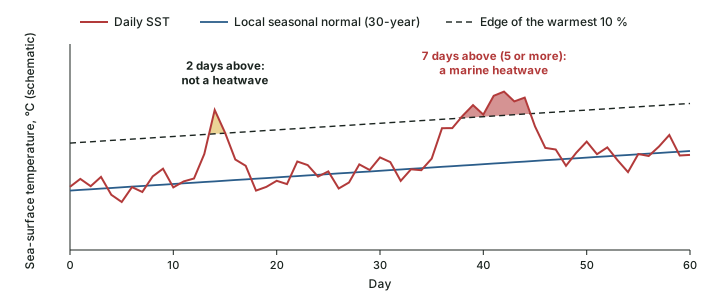
A marine heatwave is a spell of unusually warm sea water. WMO's Bulletin of 6 November 2026 gives the most widely used definition: each day's temperature is compared with what is normal for that place at that time of year, using a 30-year record, and “When temperatures stay within the warmest 10% of that historical range for five days or more, a marine heatwave is underway”. Because the yardstick is local and seasonal, a marine heatwave can be colder than an ordinary tropical day, and “marine heatwaves occur in winter as well as in summer”. As with tropical cyclones, they can be graded by severity: moderate, strong, severe and extreme (WMO Bulletin, 6 November 2026).
The same Bulletin explains why the signal is clearest at sea: the ocean has absorbed about 90 % of the additional heat trapped by greenhouse gases, and “marine heatwave days have more than tripled since 1991”. On 22 August 2026, the average sea-surface temperature outside the polar regions reached 21.1 °C, which WMO called “the highest ever measured”, surpassing the previous record set in March 2024. WMO's account of cause and effect is careful: regional ocean circulation, the atmosphere and natural climate variability shape where and when marine heatwaves occur, and “local conditions set the timing and the location, while a steadily warmer background raises the likelihood and the severity of each event”.
The 2023 El Niño year shows the pattern on a global scale. WMO reported that “The global ocean experienced an average daily marine heatwave coverage of 32%, well above the previous record of 23% in 2016”, and that “At the end of 2023, most of the global ocean between 20° S and 20° N had been in heatwave conditions since early November” (WMO, 19 March 2024). Both record years for coverage, 2016 and 2023, were El Niño years; the WMO statement records the coincidence and does not apportion the cause.
The 2026 event began on an even warmer ocean. A WMO Bulletin of 6 November 2026 notes that “The 2026 El Niño is unfolding against an extraordinary backdrop: global oceans are warmer than ever observed.” It adds: “In 2025, ocean heat content reached its highest level in the 66-year observational record, exceeding the previous record set in 2024. Remarkably, each of the last nine years has set a new record.” (WMO Bulletin, 6 November 2026).
Don't confuse
Marine heatwave vs El Niño. El Niño is a basin-scale mode of the tropical Pacific, measured by an index over overlapping three-month seasons and lasting months. A marine heatwave is a local event, measured against that place's own seasonal normal, and needs only five days. An El Niño can come with marine heatwaves, but the two are defined differently, and marine heatwaves occur in every ocean, in every season.
The 2026 El Niño and the IOD, as of mid-November 2026
A strong El Niño is under way as of mid-November 2026. The agencies have described it step by step, and each statement belongs to its date. NOAA's Climate Prediction Center (CPC) first issued an El Niño Watch on 12 March 2026. On 14 May 2026, with the Watch still in force, it judged that “El Nino is likely to emerge soon (82% chance in May-July 2026) and continue through Northern Hemisphere winter 2026-27 (96% chance in December 2026-February 2027)” (CPC, 14 May 2026). On 11 June it moved to an Advisory: “El Nino conditions are present and expected to strengthen into the Northern Hemisphere winter 2026-27” (CPC, 11 June 2026). Looking back, a WMO Bulletin noted that “El Niño conditions emerged in June and became firmly established by mid-August” (WMO, 6 November 2026).
The 2026 El Niño, agency by agency (to 12 November 2026)
| Date (2026) | Agency | What it said | Type |
|---|---|---|---|
| 12 March | NOAA CPC | La Niña Advisory / El Niño Watch: El Niño “likely to emerge (62% chance)” in June-August (discussion) | Forecast |
| 9 April | NOAA CPC | Final La Niña Advisory / El Niño Watch: ENSO-neutral present; El Niño “likely to emerge (61% chance)” in May-July (discussion) | Observation and forecast |
| 14 May | NOAA CPC | El Niño Watch continued: 82 % chance of emergence in May-July; 96 % for December 2026-February 2027 | Forecast |
| 11 June | NOAA CPC | El Niño Advisory: conditions present, expected to strengthen | Observation and forecast |
| 9 July | NOAA CPC | Advisory continued: “97% chance it will persist through early spring 2027” (discussion) | Forecast |
| 3 September | WMO | “El Niño is firmly established and will intensify into a very strong event in the coming months”; Niño 3.4 “+1.5 °C above normal during May-July 2026” (update) | Observation and forecast |
| 8 October | WMO | Near-100 % likelihood of persisting through February 2027; October-December Niño 3.4 forecast about +3.7 °C on a 1993-2009 baseline (update) | Forecast |
| 31 October | IMD | “very strong El Nino conditions are prevailing over the Equatorial Pacific Ocean” (press release) | Observation |
| 10 November | BoM | Weekly relative Niño3.4 +2.75 °C (week ending 8 November); October monthly value below the monthly record (Southern Hemisphere Monitoring) | Observation |
| 12 November | NOAA CPC | Advisory: strong-to-very strong El Niño likely through January-March 2027; RONI 1.97 °C for Aug-Oct 2026 (discussion) | Observation and forecast |
Source: the agency's own release, linked in each row. WMO's 8 October figure is a forecast on its own baseline and is not comparable with RONI or ONI values.
How strong, and is it a record?
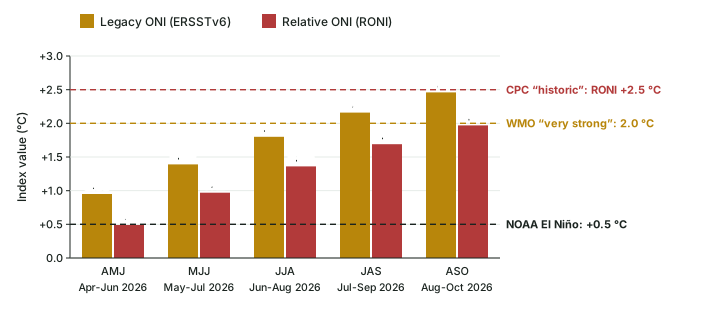
CPC's discussion of 12 November 2026 kept the El Niño Advisory and said that “El Niño continues to strengthen, with a strong-to-very strong El Niño likely through January-March 2027 (remaining greater than a 79% chance)”. The latest Niño-3.4 value in the discussion was +2.5 °C, with +3.6 °C in Niño-3 and +4.4 °C in Niño-1+2, the far-eastern region. The official three-month index tells a slower story: the RONI for Aug-Oct 2026 was 1.97 °C, against 2.46 °C on the legacy ONI (ERSSTv6) for the same season. CPC put the odds of “a historic event exceeding previous El Niños dating back to 1950 (+2.5°C or more for a 3-month RONI value )” at about 60 % for the October-December and November-January seasons, and expected that “El Niño will continue to strengthen before beginning to weaken in early 2027”. The next discussion is due on 10 December 2026.
The +2.5 °C mark is a real step: the highest RONI value before 2026 was 2.40 °C (Dec 1982-Feb 1983), computed from the RONI file. On the legacy ONI, the highest earlier value was 2.59 °C (Nov 2015-Jan 2016), still above the 2.46 °C of Aug-Oct 2026. In WMO's words, a very strong El Niño “is generally defined by a three-month average SST anomaly of at least 2.0 °C in the Niño 3.4 region” (WMO Bulletin, 6 November 2026); by Aug-Oct 2026 the legacy ONI had passed that mark (first in Jul-Sep 2026), the RONI had not.
Australia's Bureau of Meteorology (BoM) measures the event on its own relative Niño3.4 index, with its own threshold of ±0.8 °C (part 6.4). On 10 November 2026 it reported: “A strong to very strong El Niño is underway. The weekly relative Niño3.4 index was +2.75 °C for the week ending 8 November 2026, having cooled slightly from its peak value of the event so far (+2.88 °C)”. On records, BoM was explicit: “While weekly values have recently reached record levels, event records are assessed using the longer monthly relative Niño3.4 dataset that begins in 1900. The October monthly value remained below the highest monthly value on record.” (BoM, Southern Hemisphere Monitoring, 10 November 2026). So, by BoM's measure, the 2026 event was not yet a record on 10 November.
One El Niño, many numbers (November 2026)
| Number | What it is | Who, when | Kind |
|---|---|---|---|
| 1.97 °C | RONI, three-month mean, Aug-Oct 2026 | NOAA CPC, 12 November 2026 | Observation (official NOAA index) |
| 2.46 °C | Legacy ONI (ERSSTv6), Aug-Oct 2026 | NOAA CPC data file | Observation (no longer NOAA's official index) |
| +2.5 °C | Latest Niño-3.4 value in the discussion text | NOAA CPC, 12 November 2026 | Observation (not a three-month index) |
| +2.75 °C | BoM weekly relative Niño3.4, week ending 8 November (peak so far +2.88 °C) | BoM, 10 November 2026 | Observation, weekly |
| ≈ +3.7 °C | Niño 3.4, October-December 2026 average, 1993-2009 baseline | WMO, 8 October 2026 | Forecast |
| ~60 % | Chance of a 3-month RONI of +2.5 °C or more (Oct-Dec, Nov-Jan) | NOAA CPC, 12 November 2026 | Forecast probability |
Source: CPC discussion, 12 November 2026; BoM, 10 November 2026; WMO, 8 October 2026; RONI and legacy ONI files. Index values as of November 2026; NOAA revises them when datasets change.
Worked example: How far from “historic” on the RONI?
CPC defines a historic event as a 3-month RONI of +2.5 °C or more. The RONI for Aug-Oct 2026 was 1.97 °C and the legacy ONI 2.46 °C. How far short of +2.5 °C was each, and why are they different?
- RONI gap = 2.50 − 1.97 = 0.53 °C.
- Legacy ONI gap = 2.50 − 2.46 = 0.04 °C. But CPC's “historic” mark is defined on the RONI, so this second gap answers a question nobody asked.
- Difference between the indices for the same season = 2.46 − 1.97 = 0.49 °C. The RONI subtracts the anomaly of the whole tropical belt (20°N-20°S), which was itself warm, so it reads lower.
Answer: 0.53 °C short on the RONI (computed); compare indices only after naming each.
The Indian Ocean Dipole in late 2026: two agencies, two readings
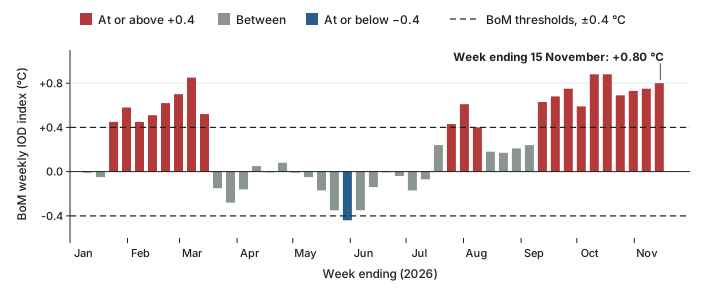
The IOD (part 6.6) shows how two careful agencies can read the same ocean differently on the same weeks. BoM reported on 10 November 2026 that “A positive Indian Ocean Dipole (IOD) event is underway. The weekly IOD index was +0.75 °C for the week ending 8 November 2026.” and expected it to be “likely to continue through November, with a return to neutral in early summer” (the southern-hemisphere summer). IMD, in its statement of 31 October 2026, wrote that “The neutral Indian Ocean Dipole (IOD) is currently prevailing” and explained why: “The Indian Ocean Dipole (IOD) has currently exceeded the positive IOD threshold (+0.4 °C). However, sustained values above this threshold are required before an event is considered established”. IMD expected neutral conditions to continue through the post-monsoon season, till December 2026.
Both use the same threshold, +0.4 °C, and both require it to be sustained. The difference is a judgement about how long is long enough, made on different dates. On BoM's weekly index the value has stayed at or above +0.4 °C every week from the week ending 13 September to the week ending 15 November (10 weeks, computed), and reached +0.80 °C in the latest week. Earlier in the year it also rose above +0.4 °C for 8 weeks (weeks ending 25 January to 15 March); part 6.6 explains the IOD's season, which is why the autumn weeks are the ones to read.
The IOD in late 2026: the two readings side by side
| Bureau of Meteorology (Australia) | India Meteorological Department | |
|---|---|---|
| Date of statement | 10 November 2026 | 31 October 2026 |
| Reading | Positive IOD event underway | Neutral IOD prevailing |
| Index value quoted | +0.75 °C, week ending 8 November | Above the +0.4 °C threshold |
| Rule applied | Sustained values above +0.4 °C | Sustained values above +0.4 °C required |
| Outlook | Positive through November; neutral in early (southern) summer | Neutral likely till December 2026 |
Source: BoM, 10 November 2026; IMD press release, 31 October 2026; BoM weekly IOD data (latest week ending 15 November 2026: +0.80 °C).
In the news
As of 18 November 2026. NOAA CPC's latest discussion (12 November 2026) keeps the El Niño Advisory, puts the RONI for Aug-Oct 2026 at 1.97 °C and gives about a 60 % chance that a 3-month RONI reaches +2.5 °C in October-December or November-January; its next discussion is due on 10 December 2026. BoM (10 November) reports a strong to very strong El Niño and a positive IOD event; IMD (31 October) reports very strong El Niño conditions and a neutral IOD. All outlooks beyond these dates are forecasts. Part 6.9 records what the 2026 monsoon season actually delivered.
Exam tip
For any current El Niño question, write four things: the agency, the date, the index (RONI, BoM relative Niño3.4, a weekly value), and whether the statement is an observation or a forecast. “El Niño of 2026 is the strongest ever” fails all four; “CPC (12 November 2026) gave a ~60 % chance of a 3-month RONI of +2.5 °C or more” passes.
Summary
- Climate variability rides on the warming trend. NOAA's relative index (RONI, official from 1 February 2026) measures Niño 3.4 against the whole tropical belt so that the trend is not counted as El Niño.
- IPCC AR6: no robust projected change in the size of ENSO's SST swings; ENSO-related rainfall variability very likely to increase; extreme (rainfall-defined) El Niño likely to intensify; low confidence on more frequent extreme positive IOD events; the MJO projected to intensify (medium confidence).
- WMO: no evidence that climate change makes El Niño more frequent or more intense, but a warmer world can amplify its impacts; WMO does not use “super El Niño”.
- The 2023-24 El Niño (mid-2023 to May 2024) peaked at 1.42 °C on the RONI and 1.99 °C on the legacy ONI; 2023 and 2024 were each the warmest year in WMO's record when reported.
- Marine heatwaves are local, five-day-or-more spells in the warmest 10 % of the local record; their days have more than tripled since 1991 (WMO, 2026).
- 2026: El Niño Advisory since 11 June (CPC); RONI 1.97 °C for Aug-Oct 2026; ~60 % chance of a historic +2.5 °C (CPC, 12 November); not yet a record by BoM's monthly measure (10 November); positive IOD by BoM, neutral by IMD.
Observation, forecast and projection
| Observation | Forecast | Projection | |
|---|---|---|---|
| What it is | A measured value of what has happened | A probability for the coming months | A model-based range for the coming decades under a scenario |
| Who issues it | CPC, BoM, IMD, WMO | CPC, BoM, IMD, WMO | IPCC (assessing many models) |
| Example in this part | RONI Aug-Oct 2026 = 1.97 °C | ~60 % chance of a 3-month RONI of +2.5 °C or more | ENSO rainfall variability very likely to increase |
| How to write it | “was”, with date and index | “is likely to”, with the probability and issue date | “is projected to”, with AR6's calibrated term |
| Can it be wrong? | It is revised when datasets change | Yes: it is a probability | It is a conditional range, not a prediction of one year |
Source: Examples from CPC, 12 November 2026, RONI data file and IPCC AR6 WGI Chapter 4.
Sources
Each table and data figure names its source beneath it. The main documents are collected here, with a date where the source carries one. Figures not listed under image credits were drawn for this page from the sources stated in their source lines.
Main sources
Image credits
| Image | Credit and licence |
|---|---|
| All other figures | Drawn for this page from the sources given in their source lines. |